Volvo 2006 Annual Report Download - page 92
Download and view the complete annual report
Please find page 92 of the 2006 Volvo annual report below. You can navigate through the pages in the report by either clicking on the pages listed below, or by using the keyword search tool below to find specific information within the annual report.-
 1
1 -
2
-
3
-
4
-
5
-
6
-
7
-
8
-
9
-
10
-
11
-
12
-
13
-
14
-
15
-
16
-
17
-
18
-
19
-
20
-
21
-
22
-
23
-
24
-
25
-
26
-
27
-
28
-
29
-
30
-
31
-
32
-
33
-
34
-
35
-
36
-
37
-
38
-
39
-
40
-
41
-
42
-
43
-
44
-
45
-
46
-
47
-
48
-
49
-
50
-
51
-
52
-
53
-
54
-
55
-
56
-
57
-
58
-
59
-
60
-
61
-
62
-
63
-
64
-
65
-
66
-
67
-
68
-
69
-
70
-
71
-
72
-
73
-
74
-
75
-
76
-
77
-
78
-
79
-
80
-
81
-
 82
82 -
 83
83 -
 84
84 -
 85
85 -
 86
86 -
 87
87 -
 88
88 -
 89
89 -
 90
90 -
 91
91 -
 92
92 -
 93
93 -
 94
94 -
 95
95 -
 96
96 -
 97
97 -
 98
98 -
 99
99 -
 100
100 -
 101
101 -
 102
102 -
103
-
104
-
105
-
106
-
107
-
108
-
109
-
110
-
111
-
112
-
113
-
114
-
115
-
116
-
117
-
118
-
119
-
120
-
121
-
122
-
123
-
124
-
125
-
126
-
127
-
128
-
129
-
130
-
131
-
132
-
133
-
134
-
135
-
136
-
137
-
138
-
139
-
140
-
141
-
142
-
143
-
144
-
145
-
146
-
147
-
148
-
149
-
150
-
151
-
152
-
153
-
154
-
155
-
156
-
157
-
158
-
159
-
160
-
161
-
162
-
163
-
164
-
165
-
166
-
167
-
168
-
169
-
170
 |
 |

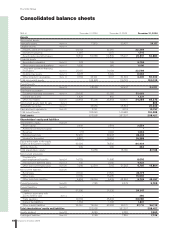
88 Financial information 2006
The Volvo Group
Consolidated balance sheets
SEK M December 31, 2004 December 31, 2005 December 31, 2006
Assets
Non-current assets
Intangible assets Note 14 17,612 20,421 19,117
Tangible assets Note 14
Property, plant and equipment 29,764 33,997 33,269
Investment property 1,387 1,071 1,110
Assets under operating leases 19,534 50,685 20,839 55,907 20,501 54,880
Financial assets
Associated companies Note 15 913 195 5,794
Other shares and participations Note 15 1,090 556 1,096
Long-term customer-fi nancing
receivables Note 16 25,187 31,184 32,089
Deferred tax assets Note 12 5,078 5,332 6,663
Other long-term receivables Note 17 2,763 35,031 3,127 40,394 4,400 50,042
Total non-current assets 103,328 116,722 124,039
Current assets
Inventories Note 18 28,598 33,937 34,211
Short-term receivables
Customer-fi nancing receivables Note 19 26,006 33,282 32,653
Current tax assets 1,426 855 1,221
Other receivables Note 20 29,864 57,296 35,464 69,601 34,399 68,273
Non-current assets held for sale Note 4 – – 805
Marketable securities Note 21 25,955 28,834 20,342
Cash and cash equivalents Note 22 8,791 8,113 10,757
Total current assets 120,640 140,485 134,388
Total assets 223,968 257,207 258,427
Shareholders’ equity and liabilities
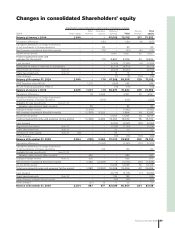
Shareholders’ equity Note 23
Share capital 2,649 2,554 2,554
Additional contributed capital – – –
Reserves (71) 2,924 1,664
Retained earnings 57,481 59,968 66,418
Income for the period 9,867 13,054 16,268
Equity attributable to the equity
holders of the parent company 69,926 78,500 86,904
Minority interests 229 260 284
Total shareholders’ equity 70,155 78,760 87,188
Non-current provisions
Provisions for
post-employment benefi ts Note 24 14,703 11,986 8,692
Provisions for deferred taxes Note 12 515 2,265 4,422
Other non-current provisions Note 25 7,296 22,514 7,012 21,263 6,750 19,864
Non-current liabilities Note 26
Bond loans 27,612 27,570 23,179
Other loans 12,799 15,985 15,530
Other long-term liabilities 4,653 45,064 5,339 48,894 6,748 45,457
Current provisions Note 25 7,182 9,279 9,799
Current liabilities Note 27
Loans 21,396 31,330 28,247
Liabilities associated with
assets held for sale Note 4 – – 280
Trade payables 30,813 35,693 38,080
Current tax liabilities 1,753 1,726 1,801
Other current liabilities 25,091 79,053 30,262 99,011 27,711 96,119
Total shareholders’ equity and liabilities 223,968 257,207 258,427
Assets pledged Note 28 3,046 3,255 1,960
Contingent liabilities Note 29 9,189 7,850 7,726