Volvo 2006 Annual Report Download - page 116
Download and view the complete annual report
Please find page 116 of the 2006 Volvo annual report below. You can navigate through the pages in the report by either clicking on the pages listed below, or by using the keyword search tool below to find specific information within the annual report.-
 1
1 -
2
-
3
-
4
-
5
-
6
-
7
-
8
-
9
-
10
-
11
-
12
-
13
-
14
-
15
-
16
-
17
-
18
-
19
-
20
-
21
-
22
-
23
-
24
-
25
-
26
-
27
-
28
-
29
-
30
-
31
-
32
-
33
-
34
-
35
-
36
-
37
-
38
-
39
-
40
-
41
-
42
-
43
-
44
-
45
-
46
-
47
-
48
-
49
-
50
-
51
-
52
-
53
-
54
-
55
-
56
-
57
-
58
-
59
-
60
-
61
-
62
-
63
-
64
-
65
-
66
-
67
-
68
-
69
-
70
-
71
-
72
-
73
-
74
-
75
-
76
-
77
-
78
-
79
-
80
-
81
-
82
-
83
-
84
-
85
-
86
-
87
-
88
-
89
-
90
-
91
-
92
-
93
-
94
-
95
-
96
-
97
-
98
-
99
-
100
-
101
-
102
-
103
-
104
-
105
-
 106
106 -
 107
107 -
 108
108 -
 109
109 -
 110
110 -
 111
111 -
 112
112 -
 113
113 -
 114
114 -
 115
115 -
 116
116 -
 117
117 -
 118
118 -
 119
119 -
 120
120 -
 121
121 -
 122
122 -
 123
123 -
 124
124 -
 125
125 -
 126
126 -
127
-
128
-
129
-
130
-
131
-
132
-
133
-
134
-
135
-
136
-
137
-
138
-
139
-
140
-
141
-
142
-
143
-
144
-
145
-
146
-
147
-
148
-
149
-
150
-
151
-
152
-
153
-
154
-
155
-
156
-
157
-
158
-
159
-
160
-
161
-
162
-
163
-
164
-
165
-
166
-
167
-
168
-
169
-
170
 |
 |
112 Financial information 2006
The Volvo Group
1 Includes on the date of IFRS adoption, acquisition costs of 14,184 and
accumulated amortization of 3,863.
2 Machinery and equipment pertains mainly to production equipment.
3 Includes subsidiaries and joint ventures that previously were accounted for
according to the equity method.
4 Acquisition costs less accumulated depreciation, amortization and write-
downs.
5 Of which is write-down 80 (72, 244).
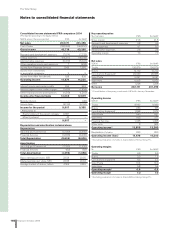
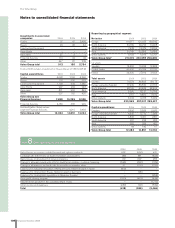
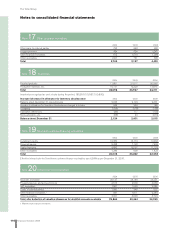
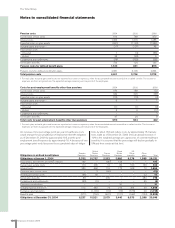
Depreciation and
amortization by type of asset 2004 2005 2006
Intangible assets 1,396 1,409 1,930
Property, plant and equipment 4,182 4,370 4,494
Assets under operating leases 4,425 4,115 4,247
Depreciations excluding
adjustment of goodwill 10,003 9,894 10,671
Adjustment of goodwill – – 1,712
Total 10,003 9,894 12,383
Capital expenditures
by type of asset 2004 2005 2006
Intangible assets 2,287 3,473 3,066
Property, plant and equipment 5,790 6,829 6,357
Assets under operating leases 4,406 4,549 4,611
Total 12,483 14,851 14,034
Capital expenditures for property, plant and equipment approved but not yet implemented at December 31, 2006, amounted to SEK 6.8 bil-
lion (7.8).
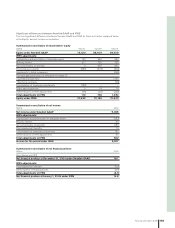
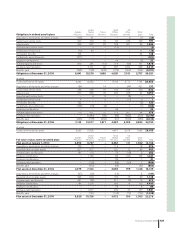
Notes to consolidated financial statements
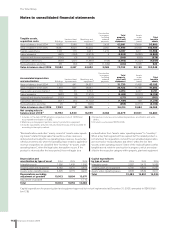
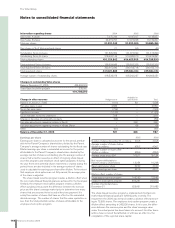
Construction
in progress, Total Assets
including property, under Total
Accumulated depreciation Land and land Machinery and advance plant and operating tangible
and amortization Buildings improvements equipment
2 payments equipment leases assets
Value in balance sheet 2004 6,732 441 24,557 – 31,730 11,465 43,195
Value in balance sheet 2005 7,814 521 28,087 – 36,422 11,160 47,582
Depreciation and amortization
5 704 46 3,744 – 4,494 4,247 8,741
Sales/scrapping (498) (8) (1,976) – (2,482) (3,223) (5,705)
Acquired and divested operations
3 (130) (9) (138) – (277) (224) (501)
Translation differences (321) (31) (1,132) – (1,484) 168 (1,316)
Reclassifi cations and other 23 8 (290) – (259) (2,474) (2,733)
Value in balance sheet 2006 7,592 527 28,295 – 36,414 9,654 46,068
Net carrying value in
balance sheet 2006
4 10,992 3,920 16,399 3,068 34,379 20,501 54,880
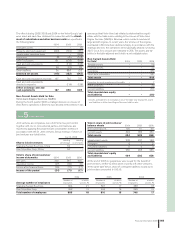
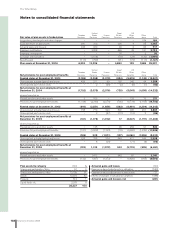
Construction
in progress, Total Assets
including property, under Total
Tangible assets, Land and land Machinery and advance plant and operating tangible
acquisition costs Buildings improvements equipment
2 payments equipment leases assets
Value in balance sheet 2004 16,928 3,988 39,530 2,435 62,881 30,999 93,880
Value in balance sheet 2005 18,547 4,624 45,252 3,067 71,490 31,999 103,489
Capital expenditures 1,031 175 3,941 1,210 6,357 4,611 10,968
Sales/scrapping (483) (106) (2,618) 4 (3,203) (5,686) (8,889)
Acquired and divested operations
3 (164) (3) (218) – (385) (593) (978)
Translation differences (808) (201) (1,889) (164) (3,062) (1,202) (4,264)
Reclassifi cations and other 461 (42) 226 (1,049) (404) 1,026 622
Value in balance sheet 2006 18,584 4,447 44,694 3,068 70,793 30,155 100,948
“Reclassifi cations and other” mainly consist of “assets under operat-
ing leases” related to legal sales transactions, where revenue is
deferred and accounted for as operating lease revenue. Assets clas-
sifi ed as inventory will, when the operating lease model is applied for
revenue recognition, be classifi ed from “inventory” to “assets under
operating leases”, when the legal sales transaction occurs. If the
product is returned after the lease period, there will again be a
reclassifi cation from “assets under operating leases” to “inventory”.
When a buy-back agreement has expired, but the related product is
not returned, the acquisition cost and the accumulated depreciation
are reversed in “reclassifi cation and other”, within the line item
“assets under operating leases”. Some of the reclassifi cations within
tangible assets relate to construction in progress, which are reclas-
sifi ed to the respective category within property, plant and equipment.