Volvo 2006 Annual Report Download - page 162
Download and view the complete annual report
Please find page 162 of the 2006 Volvo annual report below. You can navigate through the pages in the report by either clicking on the pages listed below, or by using the keyword search tool below to find specific information within the annual report.-
 1
1 -
2
-
3
-
4
-
5
-
6
-
7
-
8
-
9
-
10
-
11
-
12
-
13
-
14
-
15
-
16
-
17
-
18
-
19
-
20
-
21
-
22
-
23
-
24
-
25
-
26
-
27
-
28
-
29
-
30
-
31
-
32
-
33
-
34
-
35
-
36
-
37
-
38
-
39
-
40
-
41
-
42
-
43
-
44
-
45
-
46
-
47
-
48
-
49
-
50
-
51
-
52
-
53
-
54
-
55
-
56
-
57
-
58
-
59
-
60
-
61
-
62
-
63
-
64
-
65
-
66
-
67
-
68
-
69
-
70
-
71
-
72
-
73
-
74
-
75
-
76
-
77
-
78
-
79
-
80
-
81
-
82
-
83
-
84
-
85
-
86
-
87
-
88
-
89
-
90
-
91
-
92
-
93
-
94
-
95
-
96
-
97
-
98
-
99
-
100
-
101
-
102
-
103
-
104
-
105
-
106
-
107
-
108
-
109
-
110
-
111
-
112
-
113
-
114
-
115
-
116
-
117
-
118
-
119
-
120
-
121
-
122
-
123
-
124
-
125
-
126
-
127
-
128
-
129
-
130
-
131
-
132
-
133
-
134
-
135
-
136
-
137
-
138
-
139
-
140
-
141
-
142
-
143
-
144
-
145
-
146
-
147
-
148
-
149
-
150
-
151
-
 152
152 -
 153
153 -
 154
154 -
 155
155 -
 156
156 -
 157
157 -
 158
158 -
 159
159 -
 160
160 -
 161
161 -
 162
162 -
 163
163 -
 164
164 -
 165
165 -
 166
166 -
 167
167 -
 168
168 -
 169
169 -
 170
170
 |
 |

158 Financial information 2006
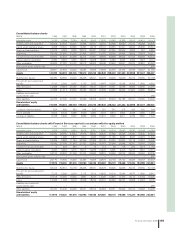
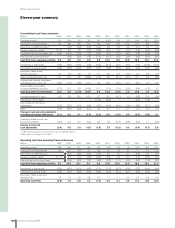
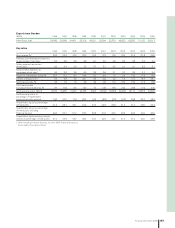
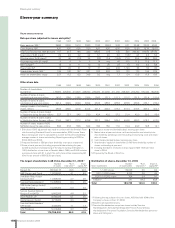
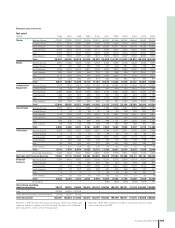
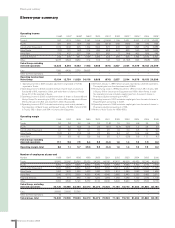
Eleven-year summary
Data per share (adjusted for issues and splits)1
1996 1997 1998 1999 2000 2001 2002 2003 2004 2005 2006
Basic earnings, SEK
1 26.90 23.20 19.10 73.00 11.20 (3.50) 3.32 0.71 23.58 32.22 40.20
Cash dividend, SEK 4.30 5.00 6.00 7.00 8.00 8.00 8.00 8.00 12.50 16.75 25.00
9
Share price at year-end, SEK (B share) 151 213 186 220 156.50 176 142 220 263.50 374.50 471.50
Direct return, % (B share)
2 2.9 2.3 3.2 3.2 5.1 4.5 5.6 10.5
8 4.7 4.5 5.3
Effective return, % (B share)
3 30 46 (10) 22 (23) 17.6 (14.8) 71.2 25.5 48.5 39.2
Price/earnings ratio (B share)
4 6 9 9 3 14 neg 43 310 11.2 11.6 11.7
EBIT multiple
5 16 9 11 10 10 25 23 14 9.2 9.3 9.8
Payout ratio, %
6 16 22 31 10 71 neg 242 1,143 53 52 62
Shareholders’ equity, SEK
7 125 140 157 221 222 203 187 173 170 194 215
Return on shareholders’ equity 23.7 17.2 13.0 34.9 5.0 neg 1.7 0.4 13.9 17.8 19.6
VOLVO SHARE STATISTICS
Other share data
1996 1997 1998 1999 2000 2001 2002 2003 2004 2005 2006
Number of shareholders
at year-end 176,800 225,500 210,600 238,000 230,000 214,000 211,000 208,500 202,300 195,442 183,735
Number of Series A shares
outstanding at year-end, millions 142.2 138.6 138.6 138.6 124.7 131.7 131.7 131.7 131.5 131.4 131.4
Number of Series B shares
outstanding at year-end, millions 321.4 302.9 302.9 302.9 272.6 287.8 287.8 287.8 278.6 273.1 273.4
Average number of outstanding
shares, millions 463.6 452.5 441.5 441.5 421.7 422.4 419.4 419.4 418.5 405.2 404.7
Number of Series A shares traded
in Stockholm during the year, millions 23.7 23.7 34.5 27.0 42.4 40.3 27.3 31.4 42.0 39.3 56.4
Number of Series B shares traded
in Stockholm during the year, millions 316.4 362.7 371.3 479.6 391.2 344.4 349.4 404.8 498.0 518.7 617.0
Number of shares traded in ADR,
NASDAQ during the year, millions 83.0 51.8 50.5 54.9 16.0 15.0 11.0 10.4 24.0 19.8 14.1
1 Effective in 1997, adjustment was made to conform with the Swedish Finan-
cial Accounting Standard Council’s recommendation, RR9, Income Taxes.
Basic earnings per share is calculated as income for the period divided by
average number of shares outstanding. Reporting according to IFRS for
2004, 2005 and 2006.
2 Proposed dividend in SEK per share divided by share price at year-end.
3 Share price at year-end, including proposed dividend during the year,
divided by share price at beginning of the year, (including redemption in
1997, distribution of one share of Swedish Match 1996, and 2006 includes
a proposed share split 6:1 in which the sixth share will be redeemed by AB
Volvo for an amount of SEK 25.00 per share).
4 Share price at year-end divided by basic earnings per share.
5 Market value at year-end minus net fi n ancial position and minority inter-
ests divided by operating income excluding restructuring costs and revalu-
ation of shares.
6 Cash dividend divided by basic earnings per share.
7 Shareholders’ equity for shareholders in AB Volvo divided by number of
shares outstanding at year-end.
8 Including distribution of shares in Ainax equal to SEK 15.05 per Volvo
share in 2004.
9 Proposed by the Board of Directors.
The largest shareholders in AB Volvo, December 31, 2006
1
Number % of Share
of shares total votes
2 capital, %
2
Renault SA 88,304,177 20.5 20.7
AMF Pension and Funds 17,874,900 4.1 4.2
Swedbank Robur fonder
(savings funds) 11,098,720 2.7 2.6
Svenska Handelsbanken
3 10,458,864 6.3 2.5
SEB fonder (savings funds)/
Trygg Försäkring 10,245,452 5.3 2.4
Second Swedish National
Pension Fund (AP2) 9,862,055 4.8 2.3
Violet Partners LP 8,340,336 5.1 2.0
Alecta (pension funds) 7,715,000 3.3 1.8
Svenska Handelsbanken/
SPP fonder 7,442,092 1.1 1.7
AFA Försäkring 5,414,494 2.0 1.3
Total 176,756,000 55.3 41.5
Distribution of shares, December 31, 2006
Number % of Share of
Volvo shareholders of shareholders total votes
2 capital, %2
1–1,000 shares 174,038 5.5 6.3
1,001–10,000 shares 8,722 3.9 4.9
10,001–100,000 shares 704 3.4 5.0
100,001– 271 87.2 83.8
Total 183,735 100.0 100.0
1 Following the repurchase of its own shares, AB Volvo held 4.9% of the
Company´s shares on Dec. 31, 2006.
2 Based on all registered shares.
3 Svenska Handelsbanken comprises shares held by Svenska
Handelsbanken, Svenska Handelsbanken Pension Fund, Svenska
Handelsbanken Personnel Foundation, Svenska Handelsbanken pensions-
kassa and Oktogonen.
Eleven-year summary