Volvo 2006 Annual Report Download - page 110
Download and view the complete annual report
Please find page 110 of the 2006 Volvo annual report below. You can navigate through the pages in the report by either clicking on the pages listed below, or by using the keyword search tool below to find specific information within the annual report.-
 1
1 -
2
-
3
-
4
-
5
-
6
-
7
-
8
-
9
-
10
-
11
-
12
-
13
-
14
-
15
-
16
-
17
-
18
-
19
-
20
-
21
-
22
-
23
-
24
-
25
-
26
-
27
-
28
-
29
-
30
-
31
-
32
-
33
-
34
-
35
-
36
-
37
-
38
-
39
-
40
-
41
-
42
-
43
-
44
-
45
-
46
-
47
-
48
-
49
-
50
-
51
-
52
-
53
-
54
-
55
-
56
-
57
-
58
-
59
-
60
-
61
-
62
-
63
-
64
-
65
-
66
-
67
-
68
-
69
-
70
-
71
-
72
-
73
-
74
-
75
-
76
-
77
-
78
-
79
-
80
-
81
-
82
-
83
-
84
-
85
-
86
-
87
-
88
-
89
-
90
-
91
-
92
-
93
-
94
-
95
-
96
-
97
-
98
-
99
-
 100
100 -
 101
101 -
 102
102 -
 103
103 -
 104
104 -
 105
105 -
 106
106 -
 107
107 -
 108
108 -
 109
109 -
 110
110 -
 111
111 -
 112
112 -
 113
113 -
 114
114 -
 115
115 -
 116
116 -
 117
117 -
 118
118 -
 119
119 -
 120
120 -
121
-
122
-
123
-
124
-
125
-
126
-
127
-
128
-
129
-
130
-
131
-
132
-
133
-
134
-
135
-
136
-
137
-
138
-
139
-
140
-
141
-
142
-
143
-
144
-
145
-
146
-
147
-
148
-
149
-
150
-
151
-
152
-
153
-
154
-
155
-
156
-
157
-
158
-
159
-
160
-
161
-
162
-
163
-
164
-
165
-
166
-
167
-
168
-
169
-
170
 |
 |

106 Financial information 2006
The Volvo Group
Reporting by business segment
The Volvo Group’s operations are organized in eight business areas:
Volvo Trucks, Renault Trucks, Mack Trucks, Buses, Construction
Equipment, Volvo Penta, Volvo Aero and Financial Services. In add-
ition to the eight business areas, there are other operations consist-
ing mainly of business units that are designed to support the business
areas’ operations. The business units include Volvo Powertrain, Volvo
3P, Volvo IT, Volvo Logistics and Volvo Parts.
Each business area, except for Financial Services, has total
responsibility for its operating income, operating capital and operat-
ing cash fl ow. The Financial Services business area has responsibil-
ity for its net income and total balance sheet within certain restric-
tions and principles that are established centrally. The supervision
and coordination of treasury and tax matters is organized centrally to
obtain the benefi ts of a Group-wide approach. The legal structure of
the Volvo Group is based on optimal handling of treasury, tax and
administrative matters and, accordingly, differs from the operating
structure.
The business units are designated to support the business areas
and are therefore not reportable business segments. In Volvo’s
external fi nancial reporting, the fi n ancial results within the business
units Powertrain and Parts are distributed to the respective business
segments. As the three truck brands share product development,
production and other activities in business units such as Volvo 3P
and Volvo Powertrain and also share certain infrastructure in distri-
bution such as dealers, the truck brands are reported as one busi-
ness segment.
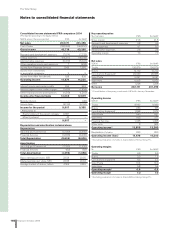
Net sales 2004 2005 2006
Trucks 136,879 155,396 166,306
Buses 12,722 16,589 16,856
Construction Equipment 29,360 34,816 40,564
Volvo Penta 9,057 9,776 10,485
Volvo Aero 6,925 7,538 8,048
Other and eliminations 7,228 7,076 5,876
Volvo Group excl
Financial Services 202,171 231,191 248,135
Financial Services 9,598 7,549 8,969
Eliminations (693) 1,819 1,731
Volvo Group total 211,076 240,559 258,835
The above sales fi g ures include internal sales in the following
amounts:
Notes to consolidated financial statements
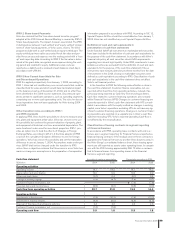
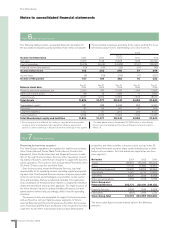
Note 7 Segment reporting
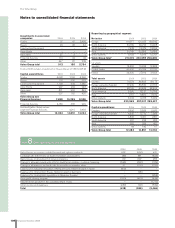
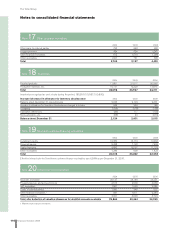
Note 6Associated companies
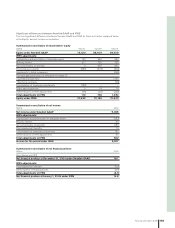
The following table presents summarized fi n ancial information for
the associated companies partly owned by Volvo. Volvo consolidate
the associated companies according to the equity method. For more
information about Volvo’s shareholding, see notes 9 and 15.
2006
Nissan
Income statement data 2004 2005 Diesel1 Other Total
Net sales 5,750 7,133 15,488 7,245 22,733
Cost of operations (5,575) (6,914) (14,874) (7,167) (22,041)
Financial income and expense (10) (16) (22) (21) (43)
Income before taxes 165 203 592 57 649
Income taxes (8) (19) (310) (17) (327)
Income of the period 157 184 282 40 322
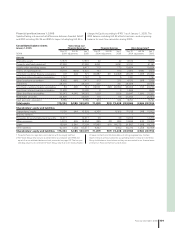
Dec 31 Dec 31 Dec 31 Dec 31 Dec 31
Balance sheet data 2004 2005 2006 2006 2006
Property, plant and equipment, net 2,099 792 10,292 1,093 11,385
Other non-current assets 88 15 7,984 11 7,995
Current assets 9,637 9,270 10,666 7,494 18,160
Total Assets 11,824 10,077 28,942 8,598 37,540
Shareholders’ equity 981 688 8,334 996 9,330
Provisions 87 55 591 47 638
Long-term liabilities 1,132 171 7,921 206 8,127
Current liabilities 9,624 9,163 12,096 7,349 19,445
Total Shareholders’ equity and liabilities 11,824 10,077 28,942 8,598 37,540
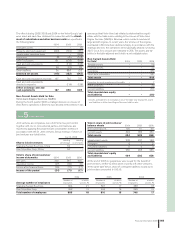
1 Since the acquisition in March, the holding is reported as an associated
company, since Volvo believes that substantial infl uence exists. Volvo
reports its share in earnings of Nissan Diesel with a time-lag of one quarter.
The table above refers to September 30, 2006, which is when Nissan
Diesel was consolidated by Volvo. Nissan Diesel’s fi s cal year is April 1–
March 31.