Volvo 2006 Annual Report Download - page 56
Download and view the complete annual report
Please find page 56 of the 2006 Volvo annual report below. You can navigate through the pages in the report by either clicking on the pages listed below, or by using the keyword search tool below to find specific information within the annual report.-
 1
1 -
2
-
3
-
4
-
5
-
6
-
7
-
8
-
9
-
10
-
11
-
12
-
13
-
14
-
15
-
16
-
17
-
18
-
19
-
20
-
21
-
22
-
23
-
24
-
25
-
26
-
27
-
28
-
29
-
30
-
31
-
32
-
33
-
34
-
35
-
36
-
37
-
38
-
39
-
40
-
41
-
42
-
43
-
44
-
45
-
 46
46 -
 47
47 -
 48
48 -
 49
49 -
 50
50 -
 51
51 -
 52
52 -
 53
53 -
 54
54 -
 55
55 -
 56
56 -
 57
57 -
 58
58 -
 59
59 -
 60
60 -
 61
61 -
 62
62 -
 63
63 -
 64
64 -
 65
65 -
 66
66 -
67
-
68
-
69
-
70
-
71
-
72
-
73
-
74
-
75
-
76
-
77
-
78
-
79
-
80
-
81
-
82
-
83
-
84
-
85
-
86
-
87
-
88
-
89
-
90
-
91
-
92
-
93
-
94
-
95
-
96
-
97
-
98
-
99
-
100
-
101
-
102
-
103
-
104
-
105
-
106
-
107
-
108
-
109
-
110
-
111
-
112
-
113
-
114
-
115
-
116
-
117
-
118
-
119
-
120
-
121
-
122
-
123
-
124
-
125
-
126
-
127
-
128
-
129
-
130
-
131
-
132
-
133
-
134
-
135
-
136
-
137
-
138
-
139
-
140
-
141
-
142
-
143
-
144
-
145
-
146
-
147
-
148
-
149
-
150
-
151
-
152
-
153
-
154
-
155
-
156
-
157
-
158
-
159
-
160
-
161
-
162
-
163
-
164
-
165
-
166
-
167
-
168
-
169
-
170
 |
 |
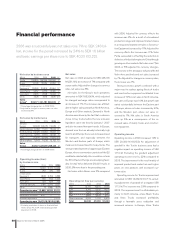
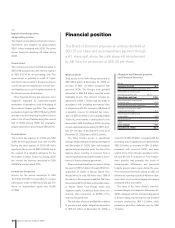
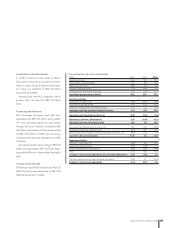
Financial position
The Board of Directors proposes an ordinary dividend of
SEK 25 per share and an extraordinary payment through
a 6:1 share split where the sixth share will be redeemed
by AB Volvo for an amount of SEK 25 per share.
Balance sheet
Total assets in the Volvo Group amounted to
SEK 258.4 billion at December 31, 2006, an
increase of SEK 1.2 billion compared with
year-end 2005. The Group’s total goodwill
amounted to SEK 8.8 billion, reported under
intangible assets. This amount includes an
adjustment of SEK 1.7 billion that was made in
accordance with prevailing accounting rules
in conjunction with the release by AB Volvo of
a valuation reserve for deferred tax receiv-
ables of SEK 2.0 billion in the subsidiary Mack
Trucks Inc. Investments in development costs
amounted to SEK 2.9 billion in 2006, resulting
in a net capitalization amounting to SEK 1.3 bil-
lion, the net value of development costs as of
December 31, 2006 was to SEK 8.2 billion.
The Volvo Group’s assets in operational
leasing remained largely unchanged compared
with December 31, 2005. Sales with buyback
agreements are reported under this item in the
balance sheet, resulting in revenues from a
sale being allocated during the length of a con-
tract as if it were a leasing agreement.
Shares and participations increased during
the year by SEK 5.5 billion through AB Volvo’s
acquisition of shares in Nissan Diesel from
Nissan Motor. In total, AB Volvo owns 19% of
the shares in the company. In addition, AB Volvo
has acquired all 57.5 million preferential shares
in Nissan Diesel from Nissan Motor and
Japanese banks. Combined, these items cor-
respond, after conversion, to 46.5% of the
shares in Nissan Diesel.
The net value of assets and liabilities related
to pensions and similar obligations amounted
to SEK 6.7 billion on December 31, 2006, a
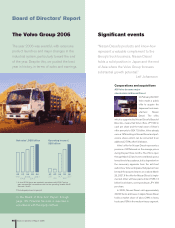
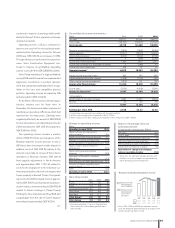
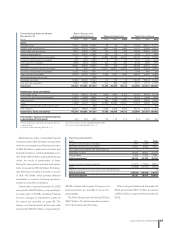
Change in net financial position,
excl Financial Services
SEK bn
December 31, 2005 18.7
Cash flow from operating activities 21.9
Investments in fixed assets
and leasing assets, net (9.3)
Operating cash flow, 12.6
Investments and divestments
of shares, net (5.8)
Acquired and divested operations 0.6
Change in provision for post-
employment benefits 3.3
Dividend paid to AB Volvo’s
shareholders (6.8)
Currency effect 1.0
Other 1.1
Total change 6.0
December 31, 2006 24.7
Impact of exchange rates
on operating income
The impact on operating income from currency
movements was negative by approximately
SEK 1 billion compared with 2005. The prime
reason being the declining US dollar during
2006.
Financial net
The net interest income for 2006 amounted to
SEK 81 M compared to a net interest expense
of SEK 318 M for the preceding year. The
improvement is primarily a result of higher
short-term interest rates in Sweden and lower
cost for the pension liability due to lower pen-
sion liabilities as a result of capital injections to
the Group’s pension foundations.
Other financial income and expenses were
negatively impacted by marked-to-market
revaluation of derivatives used for hedging of
the customer finance portfolio. The negative
revaluation impact was SEK 61 M during 2006
and was a result of declining long-term interest
rates in the US and Canada during the second
half of 2006. During 2005 the revaluation
impact was positive amounting to SEK 251 M.
Income taxes
The income tax expense for 2006 was SEK
3,981 M corresponding to a tax rate of 20%.
During the third quarter of 2006 AB Volvo
reported a tax income of SEK 2,048 M due to
the reversal of a valuation allowance for tax
receivables in Mack Trucks Inc. During 2005
the income tax expense amounted to SEK
4,908 M and a tax rate of 27%.
Income for the period
Income for the period amounted to SEK
16,318 M (13,108) corresponding to a basic
earnings per share of SEK 40.20 (32.22). The
return on shareholders’ equity was 19.6%
(17.8%).
reduction of SEK 4.8 billion compared with the
preceding year. Prepaid pensions amounted to
SEK 2.0 billion, an increase of SEK 1.5 billion
compared with year-end 2005, and were
related to the Volvo Group’s operations in the
US and the UK. A reduction in Post-employ-
ment benefits was primarily the result of
exchange-rate differences and payments
towards pension plans made during the year.
Post-employment benefits valued at SEK 2.9
billion were reported outside of AB Volvo’s bal-
ance sheet, which remained largely unchanged
compared with a year earlier.
The value of the Volvo Group’s inventory
remained largely unchanged on December 31,
2006, compared with the corresponding period
in the preceding year. During the year, finished
products declined by SEK 1.2 billion, while
production and other materials rose by SEK
1.5 billion.
52 Board of Directors’ Report 2006