Vodafone 2013 Annual Report Download - page 99
Download and view the complete annual report
Please find page 99 of the 2013 Vodafone annual report below. You can navigate through the pages in the report by either clicking on the pages listed below, or by using the keyword search tool below to find specific information within the annual report.-
 1
1 -
2
-
3
-
4
-
5
-
6
-
7
-
8
-
9
-
10
-
11
-
12
-
13
-
14
-
15
-
16
-
17
-
18
-
19
-
20
-
21
-
22
-
23
-
24
-
25
-
26
-
27
-
28
-
29
-
30
-
31
-
32
-
33
-
34
-
35
-
36
-
37
-
38
-
39
-
40
-
41
-
42
-
43
-
44
-
45
-
46
-
47
-
48
-
49
-
50
-
51
-
52
-
53
-
54
-
55
-
56
-
57
-
58
-
59
-
60
-
61
-
62
-
63
-
64
-
65
-
66
-
67
-
68
-
69
-
70
-
71
-
72
-
73
-
74
-
75
-
76
-
77
-
78
-
79
-
80
-
81
-
82
-
83
-
84
-
85
-
86
-
87
-
88
-
 89
89 -
 90
90 -
 91
91 -
 92
92 -
 93
93 -
 94
94 -
 95
95 -
 96
96 -
 97
97 -
 98
98 -
 99
99 -
 100
100 -
 101
101 -
 102
102 -
 103
103 -
 104
104 -
 105
105 -
 106
106 -
 107
107 -
 108
108 -
 109
109 -
110
-
111
-
112
-
113
-
114
-
115
-
116
-
117
-
118
-
119
-
120
-
121
-
122
-
123
-
124
-
125
-
126
-
127
-
128
-
129
-
130
-
131
-
132
-
133
-
134
-
135
-
136
-
137
-
138
-
139
-
140
-
141
-
142
-
143
-
144
-
145
-
146
-
147
-
148
-
149
-
150
-
151
-
152
-
153
-
154
-
155
-
156
-
157
-
158
-
159
-
160
-
161
-
162
-
163
-
164
-
165
-
166
-
167
-
168
-
169
-
170
-
171
-
172
-
173
-
174
-
175
-
176
-
177
-
178
-
179
-
180
-
181
-
182
-
183
-
184
-
185
-
186
-
187
-
188
-
189
-
190
-
191
-
192
 |
 |

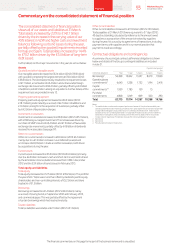
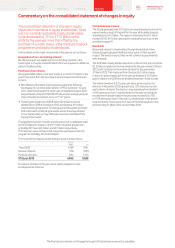
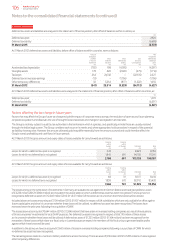
Commentary on the consolidated statement of cash ows
The consolidated statement of cash ows shows the
cash ows from operating, investing and nancing
activities for the year. Cash and cash equivalents
at the end of the nancial year increased 7.2%
to £7.6 billion. We have maintained a robust liquidity
position throughout the year enabling us to service
shareholder returns, debt and expansion through
capital investment. This position has been achieved
through cash generated from operations, dividends
from associates, and borrowings through short-
term and long-term debt issued through the capital
markets. We expect these to be our key sources
of liquidity for the foreseeable future. We also
have access to the committed facilities detailed
on page 157.
Our liquidity and working capital may be affected by a material decrease
in cash ow due to a number of factors as outlined in “Principal risk
factors and uncertainties” on pages 46 to 49. We do not use non-
consolidated special purpose entities as a source of liquidity or for other
nancing purposes.
Purchase of interest in subsidiaries and joint ventures,
net of cash acquired
During the year we acquired CWW and TelstraClear for cash
consideration of £1.1 billion and £0.4 billion respectively. Further details
on the assets and liabilities acquired are outlined in note 11.
Purchase of intangible assets
The purchase of intangible assets was primarily in relation to spectrum.
We acquired spectrum in the UK, the Netherlands, Romania, Egypt and
India, totalling £2.5 billion during the year.
Disposal of interests in associates and joint ventures
In the prior year we disposed of our 44% interest in SFR and our 24.4%
interest in Polkomtel for proceeds of £6.8 billion and £0.8 billion
respectively. There were no signicant disposals in the current year.
Disposal of investments
In April 2012 we received the remaining consideration of £1.5 billion
from the disposal of our interests in SoftBank Mobile Corp.
Purchase of investments
The Group purchases short-term investments as part of its treasury
strategy. See note 16.
Dividends received from associates
Dividends received from associates increased by 20.0% to £4.8 billion,
primarily due to dividends received from VZW. The Group received
an income dividend of £2.4 billion (2012: £2.9 billion) and also tax
distributions totalling £2.4 billion (2012: £1.0 billion) during the year.
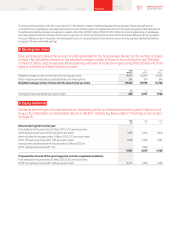
Proceeds from issues of long-term debt
The Group issued bonds, under its US shelf programme,
in September 2012 and February 2013 of US$2.0 billion (£1.2 billion)
and US$6.0 billion (£3.9 billion) respectively.
Purchase of treasury shares
During the year the Group completed the £4.0 billion share
buyback programme announced in 2011 and also initiated
a £1.5 billion programme on receipt of the income dividend from
VZWin December 2012.
Equity dividends paid
Equity dividends paid during the year decreased by -27.7%, primarily
due to the payment of a special dividend in the prior year. The special
dividend was paid following the receipt of an income dividend from VZW.
Other transactions with non-controlling shareholders
in subsidiaries
In the year ended 31 March 2012 we acquired an additional stake
in Vodafone India.
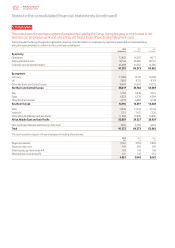
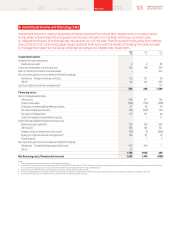
Cash ow reconciliation
A reconciliation of cash generated by operations to free cash ow
and net debt, two non-GAAP measures used by management,
is shown below. Cash generated by operations decreased by -7.4%
to £13.7 billion, primarily driven by lower EBITDA (see page 40). Free cash
ow decreased by -8.1% to £5.6 billion primarily due to lower EBITDA
and higher payments for taxation, partially offset by lower cash capital
expenditure, working capital movements and higher dividends received
from associates and investments.
2013 2012
£m £m %
EBITDA 13,275 14,475 (8.3)
Working capital 318 206
Other 134 143
Cash generated by operations 13,727 14,824 (7.4)
Cash capital expenditure1(6,195) (6,423)
Capital expenditure (6,266) (6,365)
Working capital movement in respect
of capital expenditure 71 (58)
Disposal of property, plant and
equipment 153 117
Operating free cash ow 7,685 8,518 (9.8)
Taxation (2,933) (1,969)
Dividends received from associates
and investments22,420 1,171
Dividends paid to non-controlling
shareholders in subsidiaries (379) (304)
Interest received and paid (1,185) (1,311)
Free cash ow 5,608 6,105 (8.1)
Tax settlement3 (100) (100)
Licence and spectrum payments (2,507) (1,429)
Acquisitions and disposals4(1,723) 4,872
Equity dividends paid (4,806) (6,643)
Purchase of treasury shares (1,568) (3,583)
Foreign exchange (828) 1,283
Income dividend from VZW 2,409 2,855
Other5982 2,073
Net debt (increase)/decrease (2,533) 5,433
Opening net debt (24,425) (29,858)
Closing net debt (26,958) (24,425) 10.4
Notes:
1 Cash capital expenditure comprises the purchase of property, plant and equipment and intangible assets,
other than licence and spectrum payments, during the year.
2 Dividends received from associates and investments for the year ended 31 March 2013 includes
a £2,389million (2012: £965 million) tax distribution from our 45% interest in VZW. In the year ended
31 March 2012 a nal dividend of £178 million was received from SFR prior to completion of the disposal
of the Group’s 44% interest . It does not include the £2,409 million income dividend from VZW received
in December 2012 and the £2,855 million income dividend received from VZW in January 2012.
3 Related to a tax settlement in the year ended 31 March 2011.
4 Acquisitions and disposals for the year ended 31 March 2013 primarily includes the £1,050 million
payment in relation to the acquisition of the entire share capital of CWW and £243 million in respect
of convertible bonds acquired as part of the CWW acquisition, and £440 million in relation to the
acquisition of TelstraClear. The year ended 31 March 2012 primarily included £6,805 million proceeds
from the sale of the Group’s 44% interest in SFR, £784 million proceeds from the sale of the Group’s 24.4%
interest in Polkomtel and £2,592 million payment in relation to the purchase of non-controlling interests
in Vodafone India Limited.
5 Other for the year ended 31 March 2013 primarily includes the remaining £1,499 million consideration for
the disposal of SoftBank Mobile Corp. interests in November 2010, received in April 2012, partially offset
by £322 million in relation to fair value and interest accrual movements on nancial instruments. The year
ended 31 March 2012 primarily included £2,301 million movement in the written put options in relation
to India and the return of a court deposit made in respect of the India tax case (£310 million).
Net debt
Net debt increased by £2.5 billion to £27.0 billion primarily due
to the purchase of CWW and TelstraClear, share buybacks, payments
to acquire spectrum, foreign exchange movements and dividend
payments to equity holders, partially offset by cash generated
by operations, the remaining consideration from the Group’s disposal
of SoftBank Mobile Corp. and the £2.4 billion income dividend
from VZW.
The nancial commentary on this page forms part of the business review and is unaudited.
97 Vodafone Group Plc
Annual Report 2013
Overview Business
review Performance Governance Financials Additional
information