Vodafone 2013 Annual Report Download - page 109
Download and view the complete annual report
Please find page 109 of the 2013 Vodafone annual report below. You can navigate through the pages in the report by either clicking on the pages listed below, or by using the keyword search tool below to find specific information within the annual report.-
 1
1 -
2
-
3
-
4
-
5
-
6
-
7
-
8
-
9
-
10
-
11
-
12
-
13
-
14
-
15
-
16
-
17
-
18
-
19
-
20
-
21
-
22
-
23
-
24
-
25
-
26
-
27
-
28
-
29
-
30
-
31
-
32
-
33
-
34
-
35
-
36
-
37
-
38
-
39
-
40
-
41
-
42
-
43
-
44
-
45
-
46
-
47
-
48
-
49
-
50
-
51
-
52
-
53
-
54
-
55
-
56
-
57
-
58
-
59
-
60
-
61
-
62
-
63
-
64
-
65
-
66
-
67
-
68
-
69
-
70
-
71
-
72
-
73
-
74
-
75
-
76
-
77
-
78
-
79
-
80
-
81
-
82
-
83
-
84
-
85
-
86
-
87
-
88
-
89
-
90
-
91
-
92
-
93
-
94
-
95
-
96
-
97
-
98
-
 99
99 -
 100
100 -
 101
101 -
 102
102 -
 103
103 -
 104
104 -
 105
105 -
 106
106 -
 107
107 -
 108
108 -
 109
109 -
 110
110 -
 111
111 -
 112
112 -
 113
113 -
 114
114 -
 115
115 -
 116
116 -
 117
117 -
 118
118 -
 119
119 -
120
-
121
-
122
-
123
-
124
-
125
-
126
-
127
-
128
-
129
-
130
-
131
-
132
-
133
-
134
-
135
-
136
-
137
-
138
-
139
-
140
-
141
-
142
-
143
-
144
-
145
-
146
-
147
-
148
-
149
-
150
-
151
-
152
-
153
-
154
-
155
-
156
-
157
-
158
-
159
-
160
-
161
-
162
-
163
-
164
-
165
-
166
-
167
-
168
-
169
-
170
-
171
-
172
-
173
-
174
-
175
-
176
-
177
-
178
-
179
-
180
-
181
-
182
-
183
-
184
-
185
-
186
-
187
-
188
-
189
-
190
-
191
-
192
 |
 |

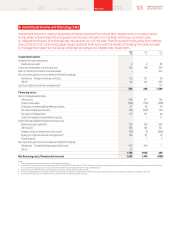
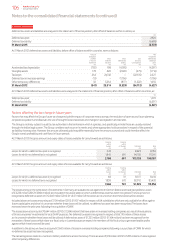
The Group holds provisions of £1,812 million (2012: £1,796 million) in respect of deferred taxation that would arise if temporary differences
on investments in subsidiaries, associates and interests in joint ventures were to be realised after the end of the reporting period (see table above).
No deferred tax liability has been recognised in respect of a further £47,978 million (2012: £51,267 million) of unremitted earnings of subsidiaries,
associates and joint ventures because the Group is in a position to control the timing of the reversal of the temporary difference and it is probable
that such differences will not reverse in the foreseeable future. It is not practicable to estimate the amount of unrecognised deferred tax liabilities
in respect of these unremitted earnings.
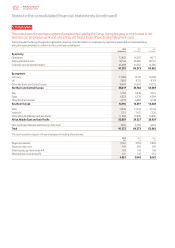
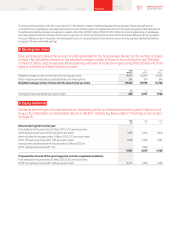
8. Earnings per share
Basic earnings per share is the amount of prot generated for the nancial year divided by the number of shares
in issue. The calculation is based on the weighted average number of shares in issue during the year. The total
number of shares used to calculate diluted earnings per share includes the impact of restricted shares and share
options, if dilutive, as if these were also issued.
2013 2012 2011
Millions Millions Millions
Weighted average number of shares for basic earnings per share 49,190 50,644 52,408
Effect of dilutive potential shares: restricted shares and share options 244 314 340
Weighted average number of shares for diluted earnings per share 49,434 50,958 52,748
£m £m £m
Earnings for basic and diluted earnings per share 429 6,957 7,968
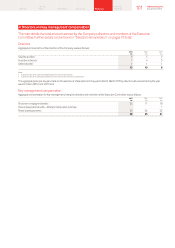
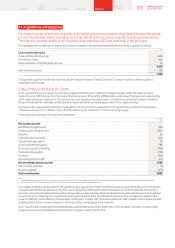
9. Equity dividends
Dividends are one type of shareholder return, historically paid to our shareholders twice a year in February and
August. For information on shareholder returns in the form of share buybacks, refer to “Purchase of own shares”
on page 95.
2013 2012 2011
£m £m £m
Declared during the nancial year:
Final dividend for the year ended 31 March 2012: 6.47 pence per share
(2011: 6.05 pence per share, 2010: 5.65 pence per share) 3,193 3,102 2,976
Interim dividend for the year ended 31 March 2013: 3.27 pence per share
(2012: 3.05 pence per share, 2011: 2.85 pence per share) 1,608 1,536 1,492
Second interim dividend share for the year ended 31 March 2013: nil
(2012: 4.00 pence per share, 2011: nil) –2,016 –
4,801 6,654 4,468
Proposed after the end of the reporting period and not recognised as a liability:
Final dividend for the year ended 31 March 2013: 6.92 pence per share
(2012: 6.47 pence per share, 2011: 6.05 pence per share) 3,377 3,195 3,106
107 Vodafone Group Plc
Annual Report 2013
Overview Business
review Performance Governance Financials Additional
information