Vodafone 2013 Annual Report Download - page 96
Download and view the complete annual report
Please find page 96 of the 2013 Vodafone annual report below. You can navigate through the pages in the report by either clicking on the pages listed below, or by using the keyword search tool below to find specific information within the annual report.-
 1
1 -
2
-
3
-
4
-
5
-
6
-
7
-
8
-
9
-
10
-
11
-
12
-
13
-
14
-
15
-
16
-
17
-
18
-
19
-
20
-
21
-
22
-
23
-
24
-
25
-
26
-
27
-
28
-
29
-
30
-
31
-
32
-
33
-
34
-
35
-
36
-
37
-
38
-
39
-
40
-
41
-
42
-
43
-
44
-
45
-
46
-
47
-
48
-
49
-
50
-
51
-
52
-
53
-
54
-
55
-
56
-
57
-
58
-
59
-
60
-
61
-
62
-
63
-
64
-
65
-
66
-
67
-
68
-
69
-
70
-
71
-
72
-
73
-
74
-
75
-
76
-
77
-
78
-
79
-
80
-
81
-
82
-
83
-
84
-
85
-
 86
86 -
 87
87 -
 88
88 -
 89
89 -
 90
90 -
 91
91 -
 92
92 -
 93
93 -
 94
94 -
 95
95 -
 96
96 -
 97
97 -
 98
98 -
 99
99 -
 100
100 -
 101
101 -
 102
102 -
 103
103 -
 104
104 -
 105
105 -
 106
106 -
107
-
108
-
109
-
110
-
111
-
112
-
113
-
114
-
115
-
116
-
117
-
118
-
119
-
120
-
121
-
122
-
123
-
124
-
125
-
126
-
127
-
128
-
129
-
130
-
131
-
132
-
133
-
134
-
135
-
136
-
137
-
138
-
139
-
140
-
141
-
142
-
143
-
144
-
145
-
146
-
147
-
148
-
149
-
150
-
151
-
152
-
153
-
154
-
155
-
156
-
157
-
158
-
159
-
160
-
161
-
162
-
163
-
164
-
165
-
166
-
167
-
168
-
169
-
170
-
171
-
172
-
173
-
174
-
175
-
176
-
177
-
178
-
179
-
180
-
181
-
182
-
183
-
184
-
185
-
186
-
187
-
188
-
189
-
190
-
191
-
192
 |
 |

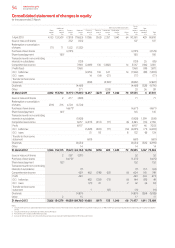
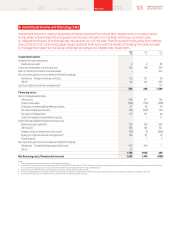
Consolidated statement of changes in equity
for the years ended 31 March
Other comprehensive income Equity
Additional share- Non-
Share paid-in Treasur y Retained Currency Pensions Investment Revaluation holders’ controlling
capital capital1shares losses reserve reserve reserve surplus Other funds interests Total
£m £m £m £m £m £m £m £m £m £m £m £m
1 April 2010 4 ,153 153,509 (7,810) (79,655) 17, 0 8 6 (363) 2,357 1,040 64 90,381 429 90,810
Issue or reissue of shares – – 232 (125) – – – – – 107 – 107
Redemption or cancellation
of shares (71) 71 1,532 (1,532) – – – – – – – –
Purchase of own shares – – (2,125) – – – – – – (2,125) – (2,125)
Share-based payment – 1802– – – – – – – 180 – 180
Transactions with non-controlling
interests in subsidiaries – – – (120) – – – – – (120) 35 (85)
Comprehensive income – – – 7, 9 6 8 (2,669) 136 (1,882) – 14 3,567 (186) 3,381
Prot/(loss) – – – 7, 9 68 – – – – – 7, 96 8 (98) 7, 8 70
OCI – before tax – – – – (2,053) 190 347 – 14 (1,502) (88) (1,590)
OCI – taxes – – – – 14 (54) (37) – – (77) – (77)
Transfer to the income
statement – – – – (630) – (2,192)3 – – (2,822) – (2,822)
Dividends – – – (4,468) – – – – – (4,468) (328) (4,796)
Other – – – 271 – – (238) – – 33 56 89
31 March 2011 4,082 153,760 (8,171) (77,661) 14,417 (227) 237 1,040 78 87,555 6 8 7, 561
Issue or reissue of shares – 2 277 (208) – – – – – 71 – 71
Redemption or cancellation
of shares (216) 216 4,724 (4,724) – – – – – – – –
Purchase of own shares – – (4,671)4 – – – – – – (4,671) – (4,671)
Share-based payment – 1452– – – – – – – 145 – 145
Transactions with non-controlling
interests in subsidiaries – – – (1,908) – – – – – (1,908) 1,599 (309)
Comprehensive income – – – 6,957 (4,279) (272) (17) – (6) 2,383 (33) 2,350
Prot – – – 6,957 – – – – – 6,957 46 7, 0 0 3
OCI – before tax – – – – (3,629) (365) (17) – (14) (4,025) (71) (4,096)
OCI – taxes – – – – 31 93 – – 8 132 (8) 124
Transfer to the income
statement – – – – (681) – – – – (681) – (681)
Dividends – – – (6,654) – – – – – (6,654) (305) (6,959)
Other – – – 14 – – – – – 14 – 14
31 March 2012 3,866 154,12 3 (7,841) (84,184) 10,13 8 (499) 220 1,040 72 76,935 1,267 78,202
Issue or reissue of shares – 2 287 (237) – – – – – 52 – 52
Purchase of own shares – – (1,475)4 – – – – – – (1,475) – (1,475)
Share-based payment – 1522 – – – – – – – 152 – 152
Transactions with non-controlling
interests in subsidiaries – – – (7) – – – – – (7) (17) (24)
Comprehensive income – – – 429 462 (198) (85) – (4) 604 145 749
Prot – – – 429 – – – – – 429 244 673
OCI – before tax – – – – 482 (259) (73) – (6) 144 (95) 49
OCI – taxes – – – – (21) 61 – – 2 42 (4) 38
Transfer to the income
statement – – – – 1 – (12) – – (11) – (11)
Dividends – – – (4,801) – – – – – (4,801) (384) (5,185)
Other – 2 – 15 – – – – – 17 – 17
31 March 2013 3,866 154,279 (9,029) (88,785) 10,600 (697) 135 1,040 68 71,477 1,011 72,488
Notes:
1 Includes share premium, capital redemption reserve and merger reserve. The merger reserve was derived from acquisitions made prior to 31 March 2004 and subsequently allocated to additional paid-in capital on adoption
of IFRS.
2 Includes £18 million tax credit (2012: £2 million; 2011: £24 million).
3 Amounts for 2011 include a £208 million tax credit.
4 Amount for 2013 includes a commitment for the purchase of own shares of £1,026 million (2012: £1,091 million; 2011: £nil).
94 Vodafone Group Plc
Annual Report 2013