Vodafone 2013 Annual Report Download - page 101
Download and view the complete annual report
Please find page 101 of the 2013 Vodafone annual report below. You can navigate through the pages in the report by either clicking on the pages listed below, or by using the keyword search tool below to find specific information within the annual report.-
 1
1 -
2
-
3
-
4
-
5
-
6
-
7
-
8
-
9
-
10
-
11
-
12
-
13
-
14
-
15
-
16
-
17
-
18
-
19
-
20
-
21
-
22
-
23
-
24
-
25
-
26
-
27
-
28
-
29
-
30
-
31
-
32
-
33
-
34
-
35
-
36
-
37
-
38
-
39
-
40
-
41
-
42
-
43
-
44
-
45
-
46
-
47
-
48
-
49
-
50
-
51
-
52
-
53
-
54
-
55
-
56
-
57
-
58
-
59
-
60
-
61
-
62
-
63
-
64
-
65
-
66
-
67
-
68
-
69
-
70
-
71
-
72
-
73
-
74
-
75
-
76
-
77
-
78
-
79
-
80
-
81
-
82
-
83
-
84
-
85
-
86
-
87
-
88
-
89
-
90
-
 91
91 -
 92
92 -
 93
93 -
 94
94 -
 95
95 -
 96
96 -
 97
97 -
 98
98 -
 99
99 -
 100
100 -
 101
101 -
 102
102 -
 103
103 -
 104
104 -
 105
105 -
 106
106 -
 107
107 -
 108
108 -
 109
109 -
 110
110 -
 111
111 -
112
-
113
-
114
-
115
-
116
-
117
-
118
-
119
-
120
-
121
-
122
-
123
-
124
-
125
-
126
-
127
-
128
-
129
-
130
-
131
-
132
-
133
-
134
-
135
-
136
-
137
-
138
-
139
-
140
-
141
-
142
-
143
-
144
-
145
-
146
-
147
-
148
-
149
-
150
-
151
-
152
-
153
-
154
-
155
-
156
-
157
-
158
-
159
-
160
-
161
-
162
-
163
-
164
-
165
-
166
-
167
-
168
-
169
-
170
-
171
-
172
-
173
-
174
-
175
-
176
-
177
-
178
-
179
-
180
-
181
-
182
-
183
-
184
-
185
-
186
-
187
-
188
-
189
-
190
-
191
-
192
 |
 |
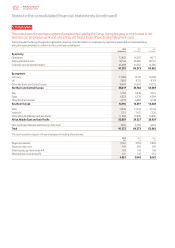
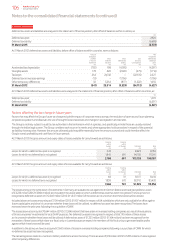
For periods commencing on or after 1 April 2013, the Group’s nancial reporting will be presented in accordance with the new standards above.
Except for IFRS 11 and the amendments to IAS 19, these pronouncements are not expected to have a material impact on the consolidated results,
nancial position or cash ows of the Group. The impact of restating key nancial information for the impact of IFRS 11 and the amendments
to IAS19 for the year to 31 March 2013 is described below:
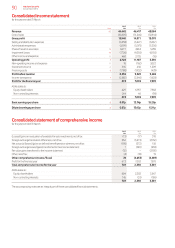
Consolidated income statement and statement of comprehensive income for the years ended:
2013 2012
As reported Adjustments New basis As reported Adjustments New basis
£m £m £m £m £m £m
Revenue 44,445 (6,404) 38,041 46,417 (7,596) 38,821
Gross prot 13,940 (2,466) 11,474 14,871 (3,251) 11,620
Share of results of equity accounted associates and
joint ventures 6,477 520 6,997 4,963 1,033 5,996
Operating prot 4,728 (508) 4,220 11,187 (702) 10,485
Prot before tax 3,255 (372) 2,883 9,549 (561) 8,988
Prot for the nancial year 673 (16) 657 7,003 (9) 6,994
Other comprehensive income 76 16 92 (4,653) 9 (4,644)
Total comprehensive income 749 – 749 2,350 – 2,350
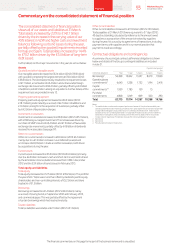
Consolidated statement of nancial position at:
2013 2012
As reported Adjustments New basis As reported Adjustments New basis
£m £m £m £m £m £m
Non-current assets 119,411 (2,736) 116,675 119,551 (3,132) 116,419
Current assets 23,287 (1,672) 21,615 20,025 (994) 19,031
Total assets 142,698 (4,408) 138,290 139,576 (4,126) 135,450
Total equity 72,488 – 72,488 78,202 –78,202
Non-current liabilities 38,986 (1,519) 37,467 37,349 (1,724) 35,625
Current liabilities 31,224 (2,889) 28,335 24,025 (2,402) 21,623
Total equity and liabilities 142,698 (4,408) 138,290 139,576 (4,126) 135,450
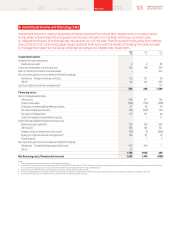
Consolidated statement of cash ows for the year ended:
2013 2012
As reported Adjustments New basis As reported Adjustments New basis
£m £m £m £m £m £m
Net cash ow from operating activities 10,694 (1,870) 8,824 12,755 (2,458) 10,297
Net cash ow from investing activities (7,398) 1,652 (5,746) 3,843 2,738 6,581
Net cash ow from nancing activities (2,956) 213 (2,743) (15,369) (300) (15,669)
Net cash ow 340 (5) 335 1,229 (20) 1,209
New accounting pronouncements to be adopted on or after 1 April 2014
The Group will adopt Amendments to IAS 32, “Offsetting nancial assets and nancial liabilities”, which is effective for annual periods beginning
on or after 1 January 2014 and has been endorsed for use in the EU, on 1 April 2014. In addition, the Group will adopt IFRIC 21, “Levies”, which
is effective for annual periods beginning on or after 1 January 2014 and has not been endorsed for use by the EU, on 1 April 2014.
Phase I of IFRS 9 “Financial Instruments” was issued in November 2009 and has subsequently been updated and amended. The standard is effective
for annual periods beginning on or after 1 January 2015 and has not yet been endorsed for use in the EU. The standard introduces changes to the
classication and measurement of nancial assets, removes the restriction on electing to measure certain nancial liabilities at fair value through the
income statement from initial recognition and requires changes to the presentation of gains and losses relating to fair value changes.
The Group is currently assessing the impact of the above new pronouncements on its results, nancial position and cash ows.
99 Vodafone Group Plc
Annual Report 2013
Overview Business
review Performance Governance Financials Additional
information