Vodafone 2013 Annual Report Download - page 154
Download and view the complete annual report
Please find page 154 of the 2013 Vodafone annual report below. You can navigate through the pages in the report by either clicking on the pages listed below, or by using the keyword search tool below to find specific information within the annual report.-
 1
1 -
2
-
3
-
4
-
5
-
6
-
7
-
8
-
9
-
10
-
11
-
12
-
13
-
14
-
15
-
16
-
17
-
18
-
19
-
20
-
21
-
22
-
23
-
24
-
25
-
26
-
27
-
28
-
29
-
30
-
31
-
32
-
33
-
34
-
35
-
36
-
37
-
38
-
39
-
40
-
41
-
42
-
43
-
44
-
45
-
46
-
47
-
48
-
49
-
50
-
51
-
52
-
53
-
54
-
55
-
56
-
57
-
58
-
59
-
60
-
61
-
62
-
63
-
64
-
65
-
66
-
67
-
68
-
69
-
70
-
71
-
72
-
73
-
74
-
75
-
76
-
77
-
78
-
79
-
80
-
81
-
82
-
83
-
84
-
85
-
86
-
87
-
88
-
89
-
90
-
91
-
92
-
93
-
94
-
95
-
96
-
97
-
98
-
99
-
100
-
101
-
102
-
103
-
104
-
105
-
106
-
107
-
108
-
109
-
110
-
111
-
112
-
113
-
114
-
115
-
116
-
117
-
118
-
119
-
120
-
121
-
122
-
123
-
124
-
125
-
126
-
127
-
128
-
129
-
130
-
131
-
132
-
133
-
134
-
135
-
136
-
137
-
138
-
139
-
140
-
141
-
142
-
143
-
 144
144 -
 145
145 -
 146
146 -
 147
147 -
 148
148 -
 149
149 -
 150
150 -
 151
151 -
 152
152 -
 153
153 -
 154
154 -
 155
155 -
 156
156 -
 157
157 -
 158
158 -
 159
159 -
 160
160 -
 161
161 -
 162
162 -
 163
163 -
 164
164 -
165
-
166
-
167
-
168
-
169
-
170
-
171
-
172
-
173
-
174
-
175
-
176
-
177
-
178
-
179
-
180
-
181
-
182
-
183
-
184
-
185
-
186
-
187
-
188
-
189
-
190
-
191
-
192
 |
 |

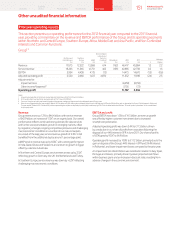
Other unaudited nancial information (continued)
Prior year operating results (continued)
Northern and Central Europe
Germany
£m
UK
£m
Other
Northern and
Central Europe
£m
Eliminations
£m
Northern and
Central Europe
£m
% change
£m Organic
Year ended 31 March 2012
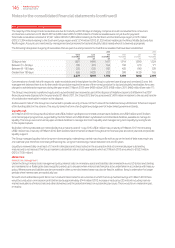
Revenue 8,233 5,397 6,042 (97) 19,575 3.6 3.7
Service revenue 7,669 4,996 5,695 (95) 18,265 2.2 2.5
EBITDA 2,965 1,294 1,675 –5,934 2.7 2.1
Adjusted operating prot 1,491 402 637 –2,530 2.2 0.8
EBITDA margin 36.0% 24.0% 27.7% 30.3%
Year ended 31 March 2011
Revenue 7,9 0 0 5,271 5,846 (117) 18,900
Service revenue 7, 471 4,931 5,589 (115) 17,876
EBITDA 2,952 1,233 1,594 –5,779
Adjusted operating prot 1,548 348 580 –2,476
EBITDA margin 37.4% 23.4% 27.3% 30.6%
Revenue increased by 3.6% including a -0.2 percentage point impact
from unfavourable foreign exchange rate movements. On an organic
basis service revenue increased by 2.5%* primarily due growth in data
revenue, partially offset by the impact of MTR cuts and competitive
pricing pressures. Growth was seen in the UK, Germany, the Netherlands
and Turkey.
EBITDA increased by 2.7% including a 0.7 percentage point favourable
impact from foreign exchange rate movements. On an organic basis
EBITDA increased by 2.1%*, resulting from higher service revenue and
direct cost efciencies, partially offset by higher customer investment
due to the increased penetration of smartphones.
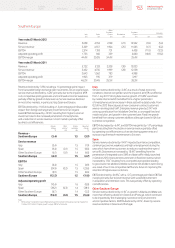
Organic
change
%
Other
activity1
pps
Foreign
exchange
pps
Reported
change
%
Revenue –
Northern and
CentralEurope 3.7 0.1 (0.2) 3.6
Service revenue
Germany 1.2 (0.1) 1.6 2.7
UK 1.6 (0.3) –1.3
Other Northern and
Central Europe 5.1 (0.3) (2.9) 1.9
Northern and
Central Europe 2.5 (0.1) (0.2) 2.2
EBITDA
Germany (1.1) –1.5 0.4
UK 5.0 (0.1) –4.9
Other Northern and
Central Europe 6.0 (0.7) (0.2) 5.1
Northern and
Central Europe 2.1 (0.1) 0.7 2.7
Adjusted operating prot
Germany (5.3) 0.1 1.5 (3.7)
UK 15.7 (0.2) –15.5
Other Northern and
Central Europe 7.9 (2.2) 4.1 9.8
Northern and
Central Europe 0.8 (0.5) 1.9 2.2
Note:
1 “Other activity” includes the impact of M&A activity and the revision to intra-group roaming charges from
1October 2011. Refer to “Organic growth” on page 188 for further detail.
Germany
Service revenue increased by 1.2%* as strong growth in data and
enterprise revenue more than offset the impact of an MTR cut effective
from 1 December 2010 and increasing competitive pressures. Data
revenue grew by 21.3%* driven by a higher penetration of smartphones,
an increase in those sold with a data bundle and the launch of prepaid
integrated tariffs. Enterprise revenue grew by 5.6%* driven by signicant
customer wins and the success of converged service offerings.
A number of innovative products were launched during the second half
of the 2012 nancial year, including OfceNet, a cloud based solution.
The roll out of LTE has continued, following the launch of services
inthe2011 nancial year. Nearly 2,700 base stations had been
upgradedto LTE at 31 March 2012, providing approximately 35%
householdcoverage.
EBITDA declined by -1.1%* as the higher revenue was offset
by restructuring costs and regulation changes.
UK
Service revenue increased by 1.6%* driven by an increase in data and
consumer contract revenue supported by the success of integrated
offerings. This was partially offset by the impact of an MTR cut effective
from 1 April 2011 and lower consumer condence leading to reduced
out-of-bundle usage. Data revenue grew by 14.5%* due to higher
penetration of smartphones and an increase in those sold with
a data bundle.
EBITDA increased by 5.0%* and EBITDA margin improved by 0.6*
percentage points, due to a number of cost saving initiatives, including
acquisition and retention efciencies.
Other Northern and Central Europe
Service revenue increased by 5.1%* as growth in the Netherlands and
Turkey more than offset a decline in the rest of the region, particularly
in Ireland, which continued to be impacted by the challenging
macroeconomic environment and competitive factors. Service revenue
in Turkey grew by 25.1%* driven by strong growth in consumer contract
and data revenue resulting from an expanding contract customer base
and the launch of innovative propositions. In the Netherlands service
revenue increased by 2.1%*, driven by an increase in the customer
base, partially offset by MTR cuts, price competition and customers
optimising tariffs.
EBITDA grew by 6.0%*, with strong growth in Turkey, driven
by a combination of service revenue growth and cost efciencies,
partially offset by declines in the majority of the other markets.
152 Vodafone Group Plc
Annual Report 2013