Vodafone 2013 Annual Report Download - page 107
Download and view the complete annual report
Please find page 107 of the 2013 Vodafone annual report below. You can navigate through the pages in the report by either clicking on the pages listed below, or by using the keyword search tool below to find specific information within the annual report.-
 1
1 -
2
-
3
-
4
-
5
-
6
-
7
-
8
-
9
-
10
-
11
-
12
-
13
-
14
-
15
-
16
-
17
-
18
-
19
-
20
-
21
-
22
-
23
-
24
-
25
-
26
-
27
-
28
-
29
-
30
-
31
-
32
-
33
-
34
-
35
-
36
-
37
-
38
-
39
-
40
-
41
-
42
-
43
-
44
-
45
-
46
-
47
-
48
-
49
-
50
-
51
-
52
-
53
-
54
-
55
-
56
-
57
-
58
-
59
-
60
-
61
-
62
-
63
-
64
-
65
-
66
-
67
-
68
-
69
-
70
-
71
-
72
-
73
-
74
-
75
-
76
-
77
-
78
-
79
-
80
-
81
-
82
-
83
-
84
-
85
-
86
-
87
-
88
-
89
-
90
-
91
-
92
-
93
-
94
-
95
-
96
-
 97
97 -
 98
98 -
 99
99 -
 100
100 -
 101
101 -
 102
102 -
 103
103 -
 104
104 -
 105
105 -
 106
106 -
 107
107 -
 108
108 -
 109
109 -
 110
110 -
 111
111 -
 112
112 -
 113
113 -
 114
114 -
 115
115 -
 116
116 -
 117
117 -
118
-
119
-
120
-
121
-
122
-
123
-
124
-
125
-
126
-
127
-
128
-
129
-
130
-
131
-
132
-
133
-
134
-
135
-
136
-
137
-
138
-
139
-
140
-
141
-
142
-
143
-
144
-
145
-
146
-
147
-
148
-
149
-
150
-
151
-
152
-
153
-
154
-
155
-
156
-
157
-
158
-
159
-
160
-
161
-
162
-
163
-
164
-
165
-
166
-
167
-
168
-
169
-
170
-
171
-
172
-
173
-
174
-
175
-
176
-
177
-
178
-
179
-
180
-
181
-
182
-
183
-
184
-
185
-
186
-
187
-
188
-
189
-
190
-
191
-
192
 |
 |

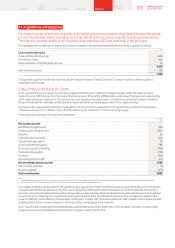
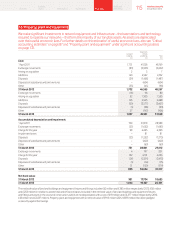
Factors affecting tax expense for the year
The table below explains the differences between the expected tax expense, at the UK statutory tax rate of 24% (2012: 26%; 2011: 28%), and the
Group’s total tax expense for each year. Further discussion of the current year tax expense can be found in the section titled “Commentary on the
consolidated income statement and statement of comprehensive income” on page 91.
2013 2012 2011
£m £m1£m1
Prot before tax as shown in the consolidated income statement 3,255 9,549 9,498
Expected income tax expense at UK statutory tax rate 781 2,483 2,659
Effect of different statutory tax rates of overseas jurisdictions 210 616 231
Impairment losses with no tax effect 2,664 1,372 1,993
Disposal of Group investments2(10) (998) (917)
Effect of taxation of associates, reported within operating prot 4 102 168
Deferred tax impact of previously unrecognised temporary differences including losses3(625) (634) (1,247)
Current tax impact of previously unrecognised temporary differences including losses (74) – (734)
Effect of unrecognised temporary differences (184) (285) 366
Adjustments in respect of prior years (273) (210) (1,088)
Gain on acquisition of CWW with no tax effect (164) – –
Effect of secondary and irrecoverable taxes 117 159 91
Deferred tax on overseas earnings (75) 15 143
Effect of current year changes in statutory tax rates (2) (3) 29
Assets revalued for tax purposes – – 121
Expenses not deductible for tax purposes and other items 224 231 332
Exclude taxation of associates (11) (302) (519)
Income tax expense 2,582 2,546 1,628
Notes:
1 Comparatives have been restated to align with the current year presentation.
2 2012 relates to the disposal of SFR and Polkomtel. 2011 relates to the disposal of China Mobile Limited and SoftBank.
3 See commentary regarding deferred tax asset recognition on page 106.
Deferred tax
Analysis of movements in the net deferred tax liability during the year:
£m
1 April 2012 (4,627)
Exchange movements (184)
Credited to the income statement 215
Credited directly to other comprehensive income 40
Credited directly to equity 1
Reclassications 1
Arising on acquisition and disposals 776
31 March 2013 (3,778)
Deferred tax assets and liabilities, before offset of balances within countries, are as follows:
Amount Net
(charged)/ recognised
credited Gross Gross Less deferred tax
in income deferred deferred tax amounts (liability)/
statement tax asset liability unrecognised asset
£m £m £m £m £m
Accelerated tax depreciation (197) 1,097 (5,097) – (4,000)
Intangible assets 85 238 (1,455) (80) (1,297)
Tax losses 164 28,248 – (26,148) 2,100
Deferred tax on overseas earnings 75 – (1,812) – (1,812)
Other temporary differences 88 3,058 (194) (1,633) 1,231
31 March 2013 215 32,641 (8,558) (27,861) (3,778)
105 Vodafone Group Plc
Annual Report 2013
Overview Business
review Performance Governance Financials Additional
information