Vodafone 2013 Annual Report Download - page 115
Download and view the complete annual report
Please find page 115 of the 2013 Vodafone annual report below. You can navigate through the pages in the report by either clicking on the pages listed below, or by using the keyword search tool below to find specific information within the annual report.-
 1
1 -
2
-
3
-
4
-
5
-
6
-
7
-
8
-
9
-
10
-
11
-
12
-
13
-
14
-
15
-
16
-
17
-
18
-
19
-
20
-
21
-
22
-
23
-
24
-
25
-
26
-
27
-
28
-
29
-
30
-
31
-
32
-
33
-
34
-
35
-
36
-
37
-
38
-
39
-
40
-
41
-
42
-
43
-
44
-
45
-
46
-
47
-
48
-
49
-
50
-
51
-
52
-
53
-
54
-
55
-
56
-
57
-
58
-
59
-
60
-
61
-
62
-
63
-
64
-
65
-
66
-
67
-
68
-
69
-
70
-
71
-
72
-
73
-
74
-
75
-
76
-
77
-
78
-
79
-
80
-
81
-
82
-
83
-
84
-
85
-
86
-
87
-
88
-
89
-
90
-
91
-
92
-
93
-
94
-
95
-
96
-
97
-
98
-
99
-
100
-
101
-
102
-
103
-
104
-
 105
105 -
 106
106 -
 107
107 -
 108
108 -
 109
109 -
 110
110 -
 111
111 -
 112
112 -
 113
113 -
 114
114 -
 115
115 -
 116
116 -
 117
117 -
 118
118 -
 119
119 -
 120
120 -
 121
121 -
 122
122 -
 123
123 -
 124
124 -
 125
125 -
126
-
127
-
128
-
129
-
130
-
131
-
132
-
133
-
134
-
135
-
136
-
137
-
138
-
139
-
140
-
141
-
142
-
143
-
144
-
145
-
146
-
147
-
148
-
149
-
150
-
151
-
152
-
153
-
154
-
155
-
156
-
157
-
158
-
159
-
160
-
161
-
162
-
163
-
164
-
165
-
166
-
167
-
168
-
169
-
170
-
171
-
172
-
173
-
174
-
175
-
176
-
177
-
178
-
179
-
180
-
181
-
182
-
183
-
184
-
185
-
186
-
187
-
188
-
189
-
190
-
191
-
192
 |
 |

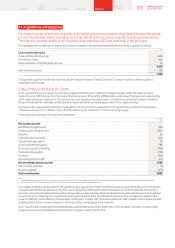
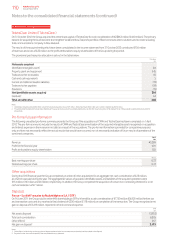
Sensitivity analysis
Other than as disclosed below, management believes that no reasonably possible change in any of the above key assumptions would cause the
carrying value of any cash generating unit to exceed its recoverable amount.
The carrying values of the Group’s operations in Italy, Spain, Portugal and Greece are equal to, or not materially greater than, their estimated
recoverable amounts; consequently, any adverse change in key assumptions would, in isolation, cause a further impairment loss to be recognised.
The estimated recoverable amounts of the Group’s operations in Germany and Romania exceeded their carrying values by approximately
£1,034 million and £184 million respectively.
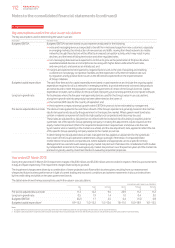
Change required for carrying value
to equal the recoverable amount
Germany Romania
pps pps
Pre-tax risk adjusted discount rate 0.4 1.0
Long-term growth rate (0.5) (1.2)
Budgeted EBITDA1(0.7) (1.7)
Budgeted capital expenditure21.1 2.8
Notes:
1 Budgeted EBITDA is expressed as the compound annual growth rates in the initial ve years for all cash-generating units of the plans used for impairment testing.
2 Budgeted capital expenditure is expressed as the range of capital expenditure as a percentage of revenue in the initial ve years for all the cash generating units of the plans used for impairment testing.
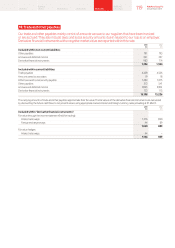
The changes in the following table to assumptions used in the impairment review would, in isolation, lead to an (increase)/decrease to the aggregate
impairment loss recognised in the year ended 31 March 2013:
Italy Spain Portugal
Increase Decrease Increase Decrease Increase Decrease
by 2pps by 2pps by 2pps by 2pps by 2pps by 2pps
£bn £bn £bn £bn £bn £bn
Pre-tax risk adjusted discount rate (1.4) 1.8 (0.7) –(0.3) –
Long-term growth rate 1.8 (1.3) –(0.7) –(0.3)
Budgeted EBITDA1 0.5 (0.5) –(0.1) –(0.1)
Budgeted capital expenditure2(0.9) 0.9 (0.6) –(0.2) –
Notes:
1 Budgeted EBITDA is expressed as the compound annual growth rates in the initial ve years for all cash-generating units of the plans used for impairment testing.
2 Budgeted capital expenditure is expressed as a percentage of revenue in the initial ve years for all the cash generating units of the plans used for impairment testing.
Year ended 31 March 2012
During the year ended 31 March 2012 impairment charges of £2,450 million, £900 million, £450 million and £250 million were recorded in respect
of the Group’s investments in Italy, Spain, Greece and Portugal, respectively. Of the total charge, £3,848 million related to goodwill and £202 million
was allocated to licence intangible assets and property, plant and equipment in Greece.
The impairment charges were primarily driven by increased discount rates as a result of increases in bond rates, with the exception of Spain where
rates reduced marginally compared to 31 March 2011. In addition, business valuations were negatively impacted by lower cash ows within business
plans reecting challenging economic and competitive conditions, and faster than expected regulatory rate cuts, particularly in Italy.
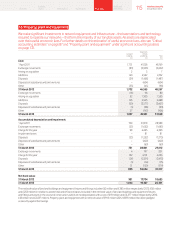
The table below shows the key assumptions used in the value in use calculations.
Assumptions used in value in use calculation
Germany Italy Spain Greece Portugal India Romania
% % % % % % %
Pre-tax risk adjusted discount rate 8.5 12.1 10.6 22.8 16.9 15.1 11.5
Long-term growth rate 1.5 1.2 1.6 1.0 2.3 6.8 3.0
Budgeted EBITDA12.3 (1.2) 3.9 (6.1) 0.2 15.0 0.8
Budgeted capital expenditure28. 5 –11.8 10.1–12.3 10.3–11.7 9.3–12.7 12.5–14.0 11.4–14.4 12.0 –14.3
Notes:
1 Budgeted EBITDA is expressed as the compound annual growth rates in the initial ve years for all cash-generating units of the plans used for impairment testing.
2 Budgeted capital expenditure is expressed as the range of capital expenditure as a percentage of revenue in the initial ve years for all cash generating units of the plans used for impairment testing.
113 Vodafone Group Plc
Annual Report 2013
Overview Business
review Performance Governance Financials Additional
information