Vodafone 2013 Annual Report Download - page 183
Download and view the complete annual report
Please find page 183 of the 2013 Vodafone annual report below. You can navigate through the pages in the report by either clicking on the pages listed below, or by using the keyword search tool below to find specific information within the annual report.-
 1
1 -
2
-
3
-
4
-
5
-
6
-
7
-
8
-
9
-
10
-
11
-
12
-
13
-
14
-
15
-
16
-
17
-
18
-
19
-
20
-
21
-
22
-
23
-
24
-
25
-
26
-
27
-
28
-
29
-
30
-
31
-
32
-
33
-
34
-
35
-
36
-
37
-
38
-
39
-
40
-
41
-
42
-
43
-
44
-
45
-
46
-
47
-
48
-
49
-
50
-
51
-
52
-
53
-
54
-
55
-
56
-
57
-
58
-
59
-
60
-
61
-
62
-
63
-
64
-
65
-
66
-
67
-
68
-
69
-
70
-
71
-
72
-
73
-
74
-
75
-
76
-
77
-
78
-
79
-
80
-
81
-
82
-
83
-
84
-
85
-
86
-
87
-
88
-
89
-
90
-
91
-
92
-
93
-
94
-
95
-
96
-
97
-
98
-
99
-
100
-
101
-
102
-
103
-
104
-
105
-
106
-
107
-
108
-
109
-
110
-
111
-
112
-
113
-
114
-
115
-
116
-
117
-
118
-
119
-
120
-
121
-
122
-
123
-
124
-
125
-
126
-
127
-
128
-
129
-
130
-
131
-
132
-
133
-
134
-
135
-
136
-
137
-
138
-
139
-
140
-
141
-
142
-
143
-
144
-
145
-
146
-
147
-
148
-
149
-
150
-
151
-
152
-
153
-
154
-
155
-
156
-
157
-
158
-
159
-
160
-
161
-
162
-
163
-
164
-
165
-
166
-
167
-
168
-
169
-
170
-
171
-
172
-
 173
173 -
 174
174 -
 175
175 -
 176
176 -
 177
177 -
 178
178 -
 179
179 -
 180
180 -
 181
181 -
 182
182 -
 183
183 -
 184
184 -
 185
185 -
 186
186 -
 187
187 -
 188
188 -
 189
189 -
 190
190 -
 191
191 -
 192
192
 |
 |

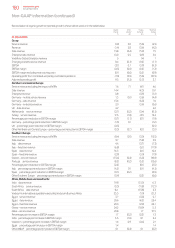
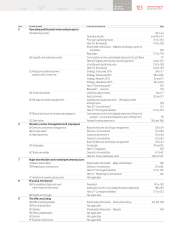
Organic
change
%
Other
activity1
pps
Foreign
exchange
pps
Reported
change
%
Verizon Wireless
Service revenue 8.1 –1.1 9.2
Revenue 7.8 –1.0 8.8
EBITDA 13.6 0.1 1.2 14.9
Group’s share of result of VZW 30.5 –1.4 31.9
31 March 2012
Group
Service revenue 1.5 (0.4) (0.8) 0.3
Revenue 2.2 (0.3) (0.7) 1.2
Service revenue for the quarter ended 31 March 2012 2.3 (0.9) (3.0) (1.6)
EBITDA (0.6) (0.3) (0.4) (1.3)
Adjusted operating prot 2.5 (4.4) (0.5) (2.4)
Northern and Central Europe
Germany – data revenue 21.3 –1.6 22.9
Germany – enterprise revenue 5.6 –1.6 7.2
UK – data revenue 14.5 – – 14.5
Netherlands – service revenue 2.1 (0.1) 1.6 3.6
Turkey – service revenue 25.1 (1.1) (17.8) 6.2
UK – percentage point increase in EBITDA margin 0.6 – – 0.6
Southern Europe
Italy – data revenue 16.8 –1.6 18.4
Italy – enterprise revenue 5.1 –1.6 6.7
Spain – data revenue 18.4 –1.9 20.3
Spain – xed line revenue 7.3 –1.6 8.9
Italy – percentage point reduction in EBITDA margin (1.9) 0.1 –(1.8)
Spain – percentage point reduction in EBITDA margin (5.5) –0.1 (5.4)
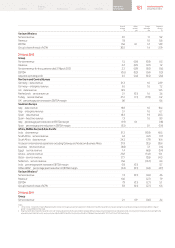
Africa, Middle East and Asia Pacic
India – data revenue 51.3 –(10.8) 40.5
South Africa – service revenue 4.4 –(6.1) (1.7)
South Africa – data revenue 24.3 –(7.9) 16.4
Vodacom’s international operations excluding Gateway and Vodacom Business Africa 31.9 –(3.5) 28.4
Australia – service revenue (8.8) –7.2 (1.6)
Egypt – service revenue 1.4 –(6.8) (5.4)
Ghana – service revenue 29.2 –(14.1) 15.1
Qatar – service revenue 27.1 –(2.8) 24.3
Safaricom – service revenue 13.6 –(13.2) 0.4
India – percentage point increase in EBITDA margin 0.8 (0.1) –0.7
Other AMAP – percentage point reduction in EBITDA margin (2.2) (0.1) (0.4) (2.7)
Verizon Wireless2
Service revenue 7.3 (0.1) (2.6) 4.6
Revenue 10.6 –(2.7) 7.9
EBITDA 7.9 (0.1) (2.7) 5.1
Group’s share of result of VZW 9.3 (0.1) (2.7) 6.5
31 March 2011
Group
Service revenue 2.1 0.9 (0.6) 2.4
Notes:
1 “Other activity” includes the impact of M&A activity, the revision to intra-group roaming charges from 1 October 2011, and the impact of Indus Towers revising its accounting for energy cost recharges. Refer to “Organic
growth” on page 188 for further detail.
2 Organic growth rates include the impact of a non-cash revenue adjustment which was recorded to properly defer previously recognised data revenue that will be earned and recognised in future periods. Excluding this the
equivalent growth rates for service revenue, revenue, adjusted EBITDA and the Group’s share of result in VZW would have been 6.8%*, 10.1%*, 6.7%* and 7.5%* respectively.
181 Vodafone Group Plc
Annual Report 2013
Overview Business
review Performance Governance Financials Additional
information