Vodafone 2013 Annual Report Download - page 149
Download and view the complete annual report
Please find page 149 of the 2013 Vodafone annual report below. You can navigate through the pages in the report by either clicking on the pages listed below, or by using the keyword search tool below to find specific information within the annual report.-
 1
1 -
2
-
3
-
4
-
5
-
6
-
7
-
8
-
9
-
10
-
11
-
12
-
13
-
14
-
15
-
16
-
17
-
18
-
19
-
20
-
21
-
22
-
23
-
24
-
25
-
26
-
27
-
28
-
29
-
30
-
31
-
32
-
33
-
34
-
35
-
36
-
37
-
38
-
39
-
40
-
41
-
42
-
43
-
44
-
45
-
46
-
47
-
48
-
49
-
50
-
51
-
52
-
53
-
54
-
55
-
56
-
57
-
58
-
59
-
60
-
61
-
62
-
63
-
64
-
65
-
66
-
67
-
68
-
69
-
70
-
71
-
72
-
73
-
74
-
75
-
76
-
77
-
78
-
79
-
80
-
81
-
82
-
83
-
84
-
85
-
86
-
87
-
88
-
89
-
90
-
91
-
92
-
93
-
94
-
95
-
96
-
97
-
98
-
99
-
100
-
101
-
102
-
103
-
104
-
105
-
106
-
107
-
108
-
109
-
110
-
111
-
112
-
113
-
114
-
115
-
116
-
117
-
118
-
119
-
120
-
121
-
122
-
123
-
124
-
125
-
126
-
127
-
128
-
129
-
130
-
131
-
132
-
133
-
134
-
135
-
136
-
137
-
138
-
 139
139 -
 140
140 -
 141
141 -
 142
142 -
 143
143 -
 144
144 -
 145
145 -
 146
146 -
 147
147 -
 148
148 -
 149
149 -
 150
150 -
 151
151 -
 152
152 -
 153
153 -
 154
154 -
 155
155 -
 156
156 -
 157
157 -
 158
158 -
 159
159 -
160
-
161
-
162
-
163
-
164
-
165
-
166
-
167
-
168
-
169
-
170
-
171
-
172
-
173
-
174
-
175
-
176
-
177
-
178
-
179
-
180
-
181
-
182
-
183
-
184
-
185
-
186
-
187
-
188
-
189
-
190
-
191
-
192
 |
 |
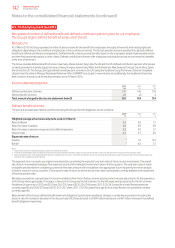
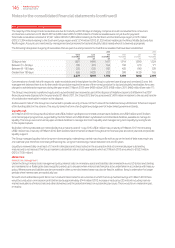
Foreign exchange management
As Vodafone’s primary listing is on the London Stock Exchange its share price is quoted in sterling. Since the sterling share price represents the value
of its future multi-currency cash ows, principally in euro, US dollars, South African rand, Indian rupee and sterling, the Group maintains the currency
of debt and interest charges in proportion to its expected future principal multi-currency cash ows and has a policy to hedge external foreign
exchange risks on transactions denominated in other currencies above certain de minimis levels. As the Group’s future cash ows are increasingly
likely to be derived from emerging markets it is likely that more debt in emerging market currencies will be drawn.
As such, at 31 March 2013 135% of net debt was denominated in currencies other than sterling (56% euro, 55% US dollar and 24% other) while 35%
of net debt had been purchased forward in sterling in anticipation of sterling denominated shareholder returns via dividends and share buybacks.
This allows euro, US dollar and other debt to be serviced in proportion to expected future cash ows and therefore provides a partial hedge against
income statement translation exposure, as interest costs will be denominated in foreign currencies.
Under the Group’s foreign exchange management policy foreign exchange transaction exposure in Group companies is generally maintained at the
lower of €5 million per currency per month or €15 million per currency over a six month period.
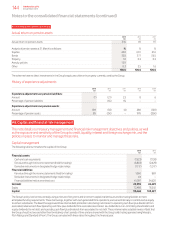
The Group recognises foreign exchange movements in equity for the translation of net investment hedging instruments and balances treated
as investments in foreign operations. However, there is no net impact on equity for exchange rate movements as there would be an offset in the
currency translation of the foreign operation.
The following table details the Group’s sensitivity of the Group’s operating prot to a strengthening of the Group’s major currencies in which
it transacts. The percentage movement applied to each currency is based on the average movements in the previous three annual reporting
periods. Amounts are calculated by retranslating the operating prot of each entity whose functional currency is either euro or US dollar.
2013
£m
Euro 3% change – Operating prot1106
US dollar 4% change – Operating prot1257
Note:
1 Operating prot before impairment losses and other income and expense.
At 31 March 2012 sensitivity of the Group’s operating prot was analysed for a strengthening of the euro by 3% and the US dollar by 4%, which
represented movements of £140 million and £195 million respectively.
Equity risk
The Group has equity investments, primarily in Bharti Infotel Private Limited, which is subject to equity risk. See note 16 for further details on the
carrying value of this investment.
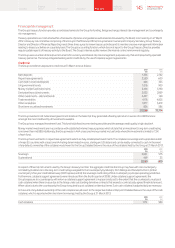
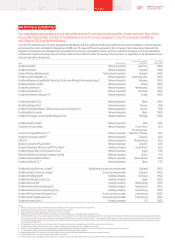
Fair value of nancial instruments
The table below sets out the valuation basis of nancial instruments held at fair value by the Group at 31 March 2013.
Level 11 Level 22 Total
2013 2012 2013 2012 2013 2012
£m £m £m £m £m £m
Financial assets:
Fair value through the income statement (heldfor
trading) – – 4,836 949 4,836 949
Derivative nancial instruments:
Interest rate swaps – –2,625 2,513 2,625 2,513
Cross currency interest rate swaps – –319 318 319 318
Foreign exchange contracts – –88 128 88 128
Interest rate futures – – 52 38 52 38
– – 7,920 3,946 7,920 3,946
Financial investments available-for-sale:
Listed equity securities33 1 – – 3 1
Unlisted equity securities3– – 498 591 498 591
3 1 498 591 501 592
3 1 8,418 4,537 8,421 4,538
Financial liabilities:
Derivative nancial instruments:
Interest rate swaps – –1,060 800 1,060 800
Foreign exchange contracts – –44 89 44 89
– – 1,104 889 1,104 889
Notes:
1 Level 1 classication comprises nancial instruments where fair value is determined by unadjusted quoted prices in active markets for identical assets or liabilities.
2 Level 2 classication comprises where fair value is determined from inputs other than quoted prices that are observable for the asset or liability, either directly or indirectly. Fair values for unlisted equity securities are derived
from observable quoted market prices for similar items. Derivative nancial instrument fair values are present values determined from future cash ows discounted at rates derived from market sourced data.
3 Details of listed and unlisted equity securities are included in note 16 “Other Investments”.
147 Vodafone Group Plc
Annual Report 2013
Overview Business
review Performance Governance Financials Additional
information