Vodafone 2013 Annual Report Download - page 104
Download and view the complete annual report
Please find page 104 of the 2013 Vodafone annual report below. You can navigate through the pages in the report by either clicking on the pages listed below, or by using the keyword search tool below to find specific information within the annual report.-
 1
1 -
2
-
3
-
4
-
5
-
6
-
7
-
8
-
9
-
10
-
11
-
12
-
13
-
14
-
15
-
16
-
17
-
18
-
19
-
20
-
21
-
22
-
23
-
24
-
25
-
26
-
27
-
28
-
29
-
30
-
31
-
32
-
33
-
34
-
35
-
36
-
37
-
38
-
39
-
40
-
41
-
42
-
43
-
44
-
45
-
46
-
47
-
48
-
49
-
50
-
51
-
52
-
53
-
54
-
55
-
56
-
57
-
58
-
59
-
60
-
61
-
62
-
63
-
64
-
65
-
66
-
67
-
68
-
69
-
70
-
71
-
72
-
73
-
74
-
75
-
76
-
77
-
78
-
79
-
80
-
81
-
82
-
83
-
84
-
85
-
86
-
87
-
88
-
89
-
90
-
91
-
92
-
93
-
 94
94 -
 95
95 -
 96
96 -
 97
97 -
 98
98 -
 99
99 -
 100
100 -
 101
101 -
 102
102 -
 103
103 -
 104
104 -
 105
105 -
 106
106 -
 107
107 -
 108
108 -
 109
109 -
 110
110 -
 111
111 -
 112
112 -
 113
113 -
 114
114 -
115
-
116
-
117
-
118
-
119
-
120
-
121
-
122
-
123
-
124
-
125
-
126
-
127
-
128
-
129
-
130
-
131
-
132
-
133
-
134
-
135
-
136
-
137
-
138
-
139
-
140
-
141
-
142
-
143
-
144
-
145
-
146
-
147
-
148
-
149
-
150
-
151
-
152
-
153
-
154
-
155
-
156
-
157
-
158
-
159
-
160
-
161
-
162
-
163
-
164
-
165
-
166
-
167
-
168
-
169
-
170
-
171
-
172
-
173
-
174
-
175
-
176
-
177
-
178
-
179
-
180
-
181
-
182
-
183
-
184
-
185
-
186
-
187
-
188
-
189
-
190
-
191
-
192
 |
 |

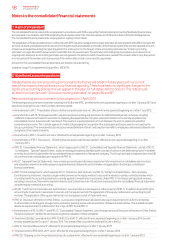
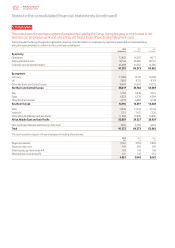
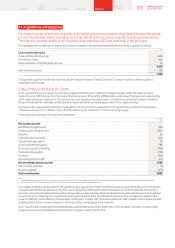
5. Employees
This note shows the average number of people employed by the Group during the year, in which areas of our
business our employees work and where they are based. It also shows total employment costs.
During the year the Group changed its organisation structure. The information on employees by segment is presented on the revised basis,
withprior years amended to conform to the current year presentation.
2013 2012 2011
Employees Employees Employees
By activity:
Operations 15,422 14,522 14,171
Selling and distribution 32,162 30,286 28,311
Customer care and administration 43,688 41,565 41,380
91,272 86,373 83,862
By segment:
Germany 11,088 12,115 12,594
UK 7,850 8,151 8,174
Other Northern and Central Europe 19,679 15,500 14,215
Northern and Central Europe 38,617 35,766 34,983
Italy 5,750 5,838 6,121
Spain 4,223 4,379 4,389
Other Southern Europe 4,219 4,480 4,738
Southern Europe 14,192 14,697 15,248
India 11,996 11,234 10,743
Vodacom 7,311 7,437 7,320
Other Africa, Middle East and Asia Pacic 11,500 10,886 10,896
Africa, Middle East and Asia Pacic 30,807 29,557 28,959
Non-Controlled Interests and Common Functions 7,656 6,353 4,672
Total 91,272 86,373 83,862
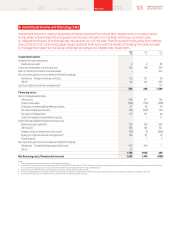
The cost incurred in respect of these employees (including directors) was:
2013 2012 2011
£m £m £m
Wages and salaries 3,331 3,158 2,960
Social security costs 419 399 392
Share-based payments (note A4) 134 143 156
Other pension costs (note A5) 167 143 134
4,051 3,843 3,642
Notes to the consolidated nancial statements (continued)
102 Vodafone Group Plc
Annual Report 2013