Vodafone 2013 Annual Report Download - page 73
Download and view the complete annual report
Please find page 73 of the 2013 Vodafone annual report below. You can navigate through the pages in the report by either clicking on the pages listed below, or by using the keyword search tool below to find specific information within the annual report.-
 1
1 -
2
-
3
-
4
-
5
-
6
-
7
-
8
-
9
-
10
-
11
-
12
-
13
-
14
-
15
-
16
-
17
-
18
-
19
-
20
-
21
-
22
-
23
-
24
-
25
-
26
-
27
-
28
-
29
-
30
-
31
-
32
-
33
-
34
-
35
-
36
-
37
-
38
-
39
-
40
-
41
-
42
-
43
-
44
-
45
-
46
-
47
-
48
-
49
-
50
-
51
-
52
-
53
-
54
-
55
-
56
-
57
-
58
-
59
-
60
-
61
-
62
-
 63
63 -
 64
64 -
 65
65 -
 66
66 -
 67
67 -
 68
68 -
 69
69 -
 70
70 -
 71
71 -
 72
72 -
 73
73 -
 74
74 -
 75
75 -
 76
76 -
 77
77 -
 78
78 -
 79
79 -
 80
80 -
 81
81 -
 82
82 -
 83
83 -
84
-
85
-
86
-
87
-
88
-
89
-
90
-
91
-
92
-
93
-
94
-
95
-
96
-
97
-
98
-
99
-
100
-
101
-
102
-
103
-
104
-
105
-
106
-
107
-
108
-
109
-
110
-
111
-
112
-
113
-
114
-
115
-
116
-
117
-
118
-
119
-
120
-
121
-
122
-
123
-
124
-
125
-
126
-
127
-
128
-
129
-
130
-
131
-
132
-
133
-
134
-
135
-
136
-
137
-
138
-
139
-
140
-
141
-
142
-
143
-
144
-
145
-
146
-
147
-
148
-
149
-
150
-
151
-
152
-
153
-
154
-
155
-
156
-
157
-
158
-
159
-
160
-
161
-
162
-
163
-
164
-
165
-
166
-
167
-
168
-
169
-
170
-
171
-
172
-
173
-
174
-
175
-
176
-
177
-
178
-
179
-
180
-
181
-
182
-
183
-
184
-
185
-
186
-
187
-
188
-
189
-
190
-
191
-
192
 |
 |

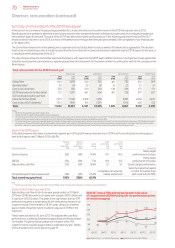
Relative spend on pay
The chart on the right shows both the total cost of remuneration in the
Group as shown on page 102 as well as the total cost of remuneration
for executive directors as shown on page 70 as well as with dividends
distributed, tax paid and prot retained in the year.
Total cost of remuneration
5,000
4,000
3,000
2,000
1,000
0Prot
retained
in the
company
Distribution
by way of
dividend
4,806
Overall
expenditure
on pay
4,051
Tax paid
in that
nancial
year
3,033
Overall
spend
on pay for
directors
23
£m
673
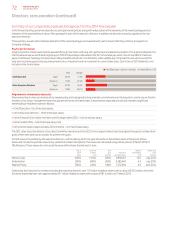
Assessing pay and performance
In the table below we summarise the CEO’s single gure remuneration over the past ve years, as well as how our variable pay plans have paid out in
relation to the maximum opportunity. This can be compared with the historic TSR performance over the same period.
Financial CEO
Single gure of
total remuneration
£’000
Annual variable element
(actual award versus
maximum opportunity)
Long-term incentive
(vesting versus
maximum opportunity)
2013 Vittorio Colao 11,032 33% 57%
2012 Vittorio Colao 15,767 47% 100%
2011 Vittorio Colao 7,022 62% 31%
20101Vittorio Colao 3,350 64% 25%
20091Vittorio Colao 2, 574 49% 0%
Note:
1 The single gure reects share awards which were granted in 2006 and 2007, prior to his appointment to CEO in 2008.
As shown in the table above, the CEO’s total remuneration decreased by 30% between the 2012 and 2013 nancial years, reecting the lower level
of incentive payouts year-on-year. Additionally, his salary has been frozen for two years, which compares with the overall salary increase budget of
1.75% in the UK for the 2014 nancial year (3.0% for the 2013 nancial year).
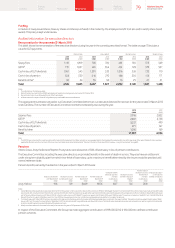
The chart on the right shows the performance of the Company relative
to the STOXX Europe 600 Index over a ve year period. The STOXX
Europe 600 Index was selected as this is a broad based index that
includes many of our closest competitors. It should be noted
thatthepayout from the long-term incentive plan is based on the
TSRperformance shown in the graph on page 70 and not this graph.
Five year historical TSR performance growth in the value
of a hypothetical €100 holding over ve years
175
150
125
100
75
50
03/08 03/09 03/10 03/11 03/12 03/13
Vodafone STOXX Europe 600 Index
100
74
60
101
93
126
101
140
100
159
115
71 Vodafone Group Plc
Annual Report 2013
Overview Business
review Performance Governance Financials Additional
information