Vodafone 2013 Annual Report Download - page 155
Download and view the complete annual report
Please find page 155 of the 2013 Vodafone annual report below. You can navigate through the pages in the report by either clicking on the pages listed below, or by using the keyword search tool below to find specific information within the annual report.-
 1
1 -
2
-
3
-
4
-
5
-
6
-
7
-
8
-
9
-
10
-
11
-
12
-
13
-
14
-
15
-
16
-
17
-
18
-
19
-
20
-
21
-
22
-
23
-
24
-
25
-
26
-
27
-
28
-
29
-
30
-
31
-
32
-
33
-
34
-
35
-
36
-
37
-
38
-
39
-
40
-
41
-
42
-
43
-
44
-
45
-
46
-
47
-
48
-
49
-
50
-
51
-
52
-
53
-
54
-
55
-
56
-
57
-
58
-
59
-
60
-
61
-
62
-
63
-
64
-
65
-
66
-
67
-
68
-
69
-
70
-
71
-
72
-
73
-
74
-
75
-
76
-
77
-
78
-
79
-
80
-
81
-
82
-
83
-
84
-
85
-
86
-
87
-
88
-
89
-
90
-
91
-
92
-
93
-
94
-
95
-
96
-
97
-
98
-
99
-
100
-
101
-
102
-
103
-
104
-
105
-
106
-
107
-
108
-
109
-
110
-
111
-
112
-
113
-
114
-
115
-
116
-
117
-
118
-
119
-
120
-
121
-
122
-
123
-
124
-
125
-
126
-
127
-
128
-
129
-
130
-
131
-
132
-
133
-
134
-
135
-
136
-
137
-
138
-
139
-
140
-
141
-
142
-
143
-
144
-
 145
145 -
 146
146 -
 147
147 -
 148
148 -
 149
149 -
 150
150 -
 151
151 -
 152
152 -
 153
153 -
 154
154 -
 155
155 -
 156
156 -
 157
157 -
 158
158 -
 159
159 -
 160
160 -
 161
161 -
 162
162 -
 163
163 -
 164
164 -
 165
165 -
166
-
167
-
168
-
169
-
170
-
171
-
172
-
173
-
174
-
175
-
176
-
177
-
178
-
179
-
180
-
181
-
182
-
183
-
184
-
185
-
186
-
187
-
188
-
189
-
190
-
191
-
192
 |
 |

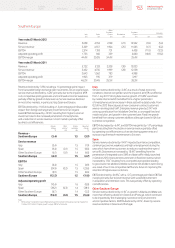
Southern Europe
Italy
£m
Spain
£m
Other
Southern
Europe
£m
Eliminations
£m
Southern
Europe
£m
% change
£m Organic
Year ended 31 March 2012
Revenue 5,658 4,763 2,128 (27) 12,522 (3.9) (5.4)
Service revenue 5,329 4,357 1,904 (25) 11,565 (4.7) (6.2)
EBITDA 2,514 1,193 731 –4,438 (11.0) (12.5)
Adjusted operating prot 1,735 566 359 –2,660 (16.8) (18.2)
EBITDA margin 44.4% 25.0% 34.4% 35.4%
Year ended 31 March 2011
Revenue 5,722 5 ,133 2,208 (30) 13,033
Service revenue 5,432 4,735 1,999 (28) 12,138
EBITDA 2,643 1,562 783 – 4,988
Adjusted operating prot 1,903 915 379 – 3,197
EBITDA margin 46.2% 30.4% 35.5% 38.3%
Revenue declined by -3.9% including a 1.5 percentage point impact
from favourable foreign exchange rate movements. On an organic basis
service revenue declined by -6.2%* primarily due to the impact of MTR
cuts, competitive pricing pressures and continued economic weakness,
partially offset by growth in data revenue. Service revenue declined
in most other markets, in particular, Italy, Spain and Greece.
EBITDA declined by -11.0% including a 1.5 percentage point favourable
impact from foreign exchange rate movements. On an organic
basis EBITDA decreased by -12.5%*, resulting from higher customer
investment due to the increased penetration of smartphones,
and a reduction in service revenue in most markets, partially offset
by direct cost efciencies.
Organic
change
%
Other
activity1
pps
Foreign
exchange
pps
Reported
change
%
Revenue –
Southern Europe (5.4) –1.5 (3.9)
Service revenue
Italy (3.4) –1.5 (1.9)
Spain (9.4) (0.1) 1.5 (8.0)
Other Southern Europe (6.1) (0.1) 1.4 (4.8)
Southern Europe (6.2) –1.5 (4.7)
EBITDA
Italy (6.4) –1.5 (4.9)
Spain (24.9) (0.2) 1.5 (23.6)
Other Southern Europe (8.1) –1.5 (6.6)
Southern Europe (12.5) –1.5 (11.0)
Adjusted operating prot
Italy (10.4) –1.6 (8.8)
Spain (39.2) (0.3) 1.4 (38.1)
Other Southern Europe (6.7) –1.4 (5.3)
Southern Europe (18.2) (0.1) 1.5 (16.8)
Note:
1 “Other activity” includes the impact of M&A activity and the revision to intra-group roaming charges from
1October 2011. Refer to “Organic growth” on page 188 for further detail.
Italy
Service revenue declined by -3.4%* as a result of weak economic
conditions, intense competition and the impact of an MTR cut effective
from 1 July 2011. Strong data revenue growth of 16.8%* was driven
by mobile internet which beneted from a higher penetration
of smartphones and an increase in those sold with a data bundle. From
Q3 of the 2012 nancial year, all new consumer contract customers
were on an integrated tariff. Enterprise revenue grew by 5.1%* with
a strong contribution from Vodafone One Net, a converged xed and
mobile solution, and growth in the customer base. Fixed line growth
beneted from strong customer additions although slowed in Q4 due
to intense competition.
EBITDA decreased by -6.4%*, and EBITDA margin fell by -1.9* percentage
points resulting from the decline in service revenue partially offset
by operating cost efciencies such as site sharing agreements and
outsourcing of network maintenance to Ericsson.
Spain
Service revenue declined by -9.4%* impacted by intense competition,
continuing economic weakness and high unemployment during the
year, which have driven customers to reduce or optimise their spend
on tariffs. Data revenue increased by 18.4%* beneting from the
penetration of integrated voice, SMS and data tariffs initially launched
in October 2010. Improvements were seen in xed line revenue which
increased by 7.3%* resulting from a competitive proposition leading
to good customer additions. Mobile customer net additions were strong
as a result of our more competitive tariffs and a focus on improving the
retention of higher-value customers.
EBITDA declined by -24.9%*, with a -5.5* percentage point fall in EBITDA
margin, primarily due to lower revenue with sustained investment
in acquisition and retention costs. This was partially offset by operating
cost efciencies.
Other Southern Europe
Service revenue declined by -6.1%* as growth in Albania and Malta was
more than offset by a decline in Greece and Portugal, which continued
to be impacted by the challenging macroeconomic environment
and competitive factors. EBITDA declined by -8.1%*, driven by service
revenue declines in Greece and Portugal.
153 Vodafone Group Plc
Annual Report 2013
Overview Business
review Performance Governance Financials Additional
information