Vodafone 2013 Annual Report Download - page 7
Download and view the complete annual report
Please find page 7 of the 2013 Vodafone annual report below. You can navigate through the pages in the report by either clicking on the pages listed below, or by using the keyword search tool below to find specific information within the annual report.
Equity interests
Northern
and Central
Europe Southern
Europe
Africa,
Middle East and
AsiaPacic
(‘AMAP’)
Non-Controlled
Interests and
Common
Functions
Revenue1£20.1bn £10.5bn £13.5bn £0.5bn
Operating free cash ow £3.3bn £2.3bn £2.5bn -£0.5bn
Adjusted operating prot £2.1bn £1.8bn £1.7bn £6.4bn
Countries Czech Republic
Germany
Hungary
Ireland
Netherlands
Romania
Turkey
United Kingdom
Albania
Greece
Italy
Malta
Portugal
Spain
Australia
Egypt
Fiji
Ghana
India
Safaricom (Kenya)2
New Zealand
Qatar
Vodacom3
Verizon Wireless2
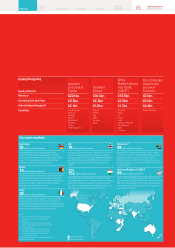
Global footprint
Our main markets
n Equity interests
n Partner interests
Notes:
1 The sum of these amounts do not equal Group
totals due to inter-company eliminations.
2 Associate.
3 Includes South Africa, Tanzania, Mozambique,
Lesotho, and the Democratic Republic of Congo.
4 At December 2012.
5 Represents the Group’s interest on a 100%
owned basis. Based on equity interests the
Group’s customer base is 22 million in Italy
and45 million in VZW.
To see more information on our markets follow this link
vodafone.com/investor
Germany
32 million mobile customers
Our largest market, generating annual revenue
of £7.9billion. We have a leading position with 35%
service revenue market share. This was our rst market
to launch our ultra-fast 4G services which are now
available to around 61% of the population.
Spain
14 million mobile customers
The severe recession combined with intense competition
has led to falling revenue in Spain. However we remain
condent in the country’s future prospects and therefore
we plan to co-invest €1 billion with another operator,
to deploy a high speed bre network.
Italy
29 million mobile customers5
We are the largest mobile operator in Italy with a 35%
service revenue share. A combination of economic,
competitive and regulatory pressures has led to a decline
in revenue during the year, but due to careful cost control
we have maintained a good level of protability.
UK
19 million mobile customers
We have a 25% service revenue market share in the UK,
and are a leading player among enterprise customers.
Duringtheyear we acquired Cable & Wireless Worldwide
plc (‘CWW’); and we invested £803 million in spectrum
to support the launch of ultra-fast 4Gservices later
in 2013.
India
152 million mobile customers
Our largest market measured by customers. We have
a strong brand position, an extensive range of distribution
outlets and nationwide network coverage. As a result,
our revenue market share has increased every year over
the last four years and now stands at over 21%4.
Vodacom3
59 million mobile customers
We own 65% of Vodacom which covers ve countries
inAfrica – South Africa, Tanzania, Mozambique, Lesotho,
and the Democratic Republic of Congo. In South
Africa, which accounts for 84% of Vodacom’s revenue,
we launched the country’s rst commercial 4G service
in October 2012.
Verizon Wireless (‘VZW’)2
99 million mobile customers5
We own 45% of VZW, the largest mobile operator in the
US by revenue. Its leading 4G network now covers around
90% of the US population. VZW continued to trade well
delivering further market share gains and strong service
revenue growth of 8.1%*.
05 Vodafone Group Plc
Annual Report 2013
Overview Business
review Performance Governance Financials Additional
information

