Vodafone 2013 Annual Report Download - page 46
Download and view the complete annual report
Please find page 46 of the 2013 Vodafone annual report below. You can navigate through the pages in the report by either clicking on the pages listed below, or by using the keyword search tool below to find specific information within the annual report.-
 1
1 -
2
-
3
-
4
-
5
-
6
-
7
-
8
-
9
-
10
-
11
-
12
-
13
-
14
-
15
-
16
-
17
-
18
-
19
-
20
-
21
-
22
-
23
-
24
-
25
-
26
-
27
-
28
-
29
-
30
-
31
-
32
-
33
-
34
-
35
-
 36
36 -
 37
37 -
 38
38 -
 39
39 -
 40
40 -
 41
41 -
 42
42 -
 43
43 -
 44
44 -
 45
45 -
 46
46 -
 47
47 -
 48
48 -
 49
49 -
 50
50 -
 51
51 -
 52
52 -
 53
53 -
 54
54 -
 55
55 -
 56
56 -
57
-
58
-
59
-
60
-
61
-
62
-
63
-
64
-
65
-
66
-
67
-
68
-
69
-
70
-
71
-
72
-
73
-
74
-
75
-
76
-
77
-
78
-
79
-
80
-
81
-
82
-
83
-
84
-
85
-
86
-
87
-
88
-
89
-
90
-
91
-
92
-
93
-
94
-
95
-
96
-
97
-
98
-
99
-
100
-
101
-
102
-
103
-
104
-
105
-
106
-
107
-
108
-
109
-
110
-
111
-
112
-
113
-
114
-
115
-
116
-
117
-
118
-
119
-
120
-
121
-
122
-
123
-
124
-
125
-
126
-
127
-
128
-
129
-
130
-
131
-
132
-
133
-
134
-
135
-
136
-
137
-
138
-
139
-
140
-
141
-
142
-
143
-
144
-
145
-
146
-
147
-
148
-
149
-
150
-
151
-
152
-
153
-
154
-
155
-
156
-
157
-
158
-
159
-
160
-
161
-
162
-
163
-
164
-
165
-
166
-
167
-
168
-
169
-
170
-
171
-
172
-
173
-
174
-
175
-
176
-
177
-
178
-
179
-
180
-
181
-
182
-
183
-
184
-
185
-
186
-
187
-
188
-
189
-
190
-
191
-
192
 |
 |

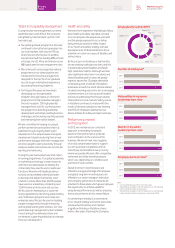
EBITDA grew by 10.3%*, with a 1.6* percentage point increase in EBITDA
margin, primarily driven by revenue growth in Vodacom’s mobile
operations outside South Africa and savings in network costs in South
Africa following investment in single RAN and transmission equipment.
Other AMAP
Organic service revenue decreased by -2.1%* with growth in Egypt,
Ghana and Qatar more than offset by revenue declines in Australia
and New Zealand. Australia continued to experience steep revenue
declines on the back of ongoing service perception issues and
a declining customer base. There has been a strong focus on network
improvement and arresting the weakness in brand perception. In Egypt
the launch of value management initiatives, take-up of data services
and the increase in international incoming call volumes and rates drove
service revenue growth of 3.7%*, despite competitive pressures and
the uncertain political environment. Data revenue continued to show
strong growth of 29.6%* and xed line revenue grew by 29.0%*. In Qatar
service revenue grew by 29.8%*, driven by the growth in the customer
base, which is now over one million, supported by successful new
propositions. In Ghana, continued strong growth in the customer base
and the success of integrated tariffs led to service revenue growth
of 24.2%*.
EBITDA declined by -2.6%*, with EBITDA margin remaining stable, with
the impact of service revenue declines in Australia and New Zealand
offsetting growth in Egypt, Qatar and Ghana.
References to “Q2” are to the quarter ended 30 September 2012, references to the “Q3” or “previous quarter”
are to the quarter ended 31 December 2013, and references to “Q4” and “fourth quarter” are to the quarter
ended 31 March 2013 unless otherwise stated. References to the “rst half of the year” are to the six months
ended 30 September 2012 and references to “H2” or the “second half of the year” are to the six months ended
31 March 2013 unless otherwise stated. References to the “year” or “nancial year” are to the nancial year
ended 31 March 2013, references to the “prior nancial year” are to the nancial year ended 31 March 2012,
and references to the “new nancial year” and “coming year” are to the nancial year ended 31 March 2014
unless otherwise stated. References to the”2012 nancial year”, “2013 nancial year”, the “2014 nancial year”,
the “2015 nancial year”, and the “2016 nancial year” are to the nancial years ended/ending 31 March 2012,
2013, 2014, 2015 and 2016, respectively.
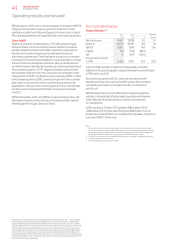
Non-Controlled Interests
Verizon Wireless1 2 3
2013
£m
2012
£m
% change
£Organic
Service revenue 19,697 18,039 9.2 8.1
Revenue 21,972 20,187 8.8 7.8
EBITDA 8,831 7,689 14.9 13.6
Interest (25) (212) (88.2)
Tax213 (287) (104.5)
Group’s share of result
in VZW 6,422 4,867 31.9 30.5
In the US VZW reported 5.9 million net mobile retail connection
additions in the year, bringing its closing mobile retail connection base
to 98.9 million, up 6.4%.
Service revenue growth of 8.1%* continued to be driven by the
expanding number of accounts and ARPA4 growth from increased
smartphone penetration and a higher number of connections
per account.
EBITDA margin improved, with efciencies in operating expenses
and direct costs partially offset by higher acquisition and retention
costs reecting the increased new connections and demand
for smartphones.
VZW’s net debt at 31 March 2013 totalled US$6.2 billion5 (2012:
US$6.4 billion5). During the year VZW paid a US$8.5 billion income
dividend to its shareholders and completed the acquisition of spectrum
licences for US$3.7 billion (net).
Notes:
1 All amounts represent the Group’s share based on its 45% equity interest, unless otherwise stated.
2 The Group’s share of the tax attributable to VZW relates only to the corporate entities held by the VZW
partnership and certain US state taxes which are levied on the partnership. The tax attributable to the
Group’s share of the partnership’s pre-tax prot is included within the Group tax charge.
3 The denition of “connections” reported by VZW is the same as “customers” as reported by Vodafone.
4 Average monthly revenue per account.
5 Net debt excludes pending credit card receipts.
Operating results (continued)
44 Vodafone Group Plc
Annual Report 2013