Vodafone 2013 Annual Report Download - page 127
Download and view the complete annual report
Please find page 127 of the 2013 Vodafone annual report below. You can navigate through the pages in the report by either clicking on the pages listed below, or by using the keyword search tool below to find specific information within the annual report.-
 1
1 -
2
-
3
-
4
-
5
-
6
-
7
-
8
-
9
-
10
-
11
-
12
-
13
-
14
-
15
-
16
-
17
-
18
-
19
-
20
-
21
-
22
-
23
-
24
-
25
-
26
-
27
-
28
-
29
-
30
-
31
-
32
-
33
-
34
-
35
-
36
-
37
-
38
-
39
-
40
-
41
-
42
-
43
-
44
-
45
-
46
-
47
-
48
-
49
-
50
-
51
-
52
-
53
-
54
-
55
-
56
-
57
-
58
-
59
-
60
-
61
-
62
-
63
-
64
-
65
-
66
-
67
-
68
-
69
-
70
-
71
-
72
-
73
-
74
-
75
-
76
-
77
-
78
-
79
-
80
-
81
-
82
-
83
-
84
-
85
-
86
-
87
-
88
-
89
-
90
-
91
-
92
-
93
-
94
-
95
-
96
-
97
-
98
-
99
-
100
-
101
-
102
-
103
-
104
-
105
-
106
-
107
-
108
-
109
-
110
-
111
-
112
-
113
-
114
-
115
-
116
-
 117
117 -
 118
118 -
 119
119 -
 120
120 -
 121
121 -
 122
122 -
 123
123 -
 124
124 -
 125
125 -
 126
126 -
 127
127 -
 128
128 -
 129
129 -
 130
130 -
 131
131 -
 132
132 -
 133
133 -
 134
134 -
 135
135 -
 136
136 -
 137
137 -
138
-
139
-
140
-
141
-
142
-
143
-
144
-
145
-
146
-
147
-
148
-
149
-
150
-
151
-
152
-
153
-
154
-
155
-
156
-
157
-
158
-
159
-
160
-
161
-
162
-
163
-
164
-
165
-
166
-
167
-
168
-
169
-
170
-
171
-
172
-
173
-
174
-
175
-
176
-
177
-
178
-
179
-
180
-
181
-
182
-
183
-
184
-
185
-
186
-
187
-
188
-
189
-
190
-
191
-
192
 |
 |
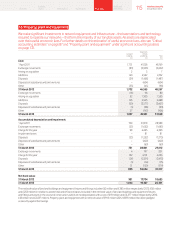
The fair value and carrying value of the Group’s long-term borrowings is as follows:
Sterling equivalent
nominal value Fair value Carrying value
2013 2012 2013 2012 2013 2012
£m £m £m £m £m £m
Financial liabilities measured at amortised cost:
Bank loans 4,200 5,336 4,326 5,625 4,281 5,624
Redeemable preference shares 1,086 1,032 1,020 1,199 1,355 1,281
Other liabilities 731 2,325 821 2,472 753 2,417
Bonds: 14,456 13,184 15,986 14,746 15,698 14,463
Czech koruna oating rate note due June 2013 – 18 – 18 – 18
Euro oating rate note due September 2013 – 638 – 641 – 638
5.0% US dollar 1,000 million bond due December 2013 – 625 – 669 – 657
6.875% euro 1,000 million bond due December 2013 – 763 – 834 – 786
Euro oating rate note due June 2014 949 938 952 939 951 938
4.15% US dollar 1,250 million bond due June 2014 795 755 828 808 810 773
4.625% sterling 350 million bond due September 2014 304 304 319 325 320 326
4.625% sterling 525 million bond due September 2014 525 525 552 562 541 541
5.125% euro 500 million bond due April 2015 422 417 4 61 463 446 442
5.0% US dollar 750 million bond due September 2015 494 469 543 528 521 505
3.375% US dollar 500 million bond due November 2015 329 313 349 335 331 314
6.25% euro 1,250 million bond due January 2016 949 938 1,091 1,094 964 953
0.9% US dollar 900 million bond due February 2016 592 –592 –592 –
US dollar oating rate note due February 2016 461 –460 –4 61 –
2.875% US dollar 600 million bond due March 2016 395 375 416 393 394 374
5.75% US dollar 750 million bond due March 2016 494 469 561 543 536 522
4.75% euro 500 million bond due June 2016 422 417 474 469 455 455
5.625% US dollar 1,300 million bond due February 2017 856 813 995 954 937 908
1.625% US dollar 1,000 million bond due March 2017 658 625 665 624 655 621
1.25% US dollar 1,000 million bond due September 2017 658 –654 –655 –
5.375% sterling 600 million bond due December 2017 552 552 646 632 571 573
1.5% US dollar 1,400 million bond due February 2018 921 –922 –917
5% euro 750 million bond due June 2018 633 625 750 726 658 650
4.625% US dollar 500 million bond due July 2018 329 –376 –387 –
8.125% sterling 450 million bond due November 2018 450 450 598 589 483 485
4.375% US dollar 500 million bond due March 2021 329 313 371 348 327 310
7.875% US dollar 750 million bond due February 2030 494 469 699 648 778 751
6.25% US dollar 495 million bond due November 2032 326 310 399 377 442 424
6.15% US dollar 1,700 million bond due February 2037 1,119 1,063 1,313 1,227 1,566 1,499
Bonds in fair value hedge relationships: 6,287 3,882 6,969 4,541 7, 021 4,577
2.15% Japanese yen 3,000 million bond due April 2015 21 23 22 24 21 23
5.375% US dollar 900 million bond due January 2015 592 563 641 628 633 621
4.625% US dollar 500 million bond due July 2018 – 313 – 354 – 367
5.45% US dollar 1,250 million bond due June 2019 823 782 980 920 957 898
4.65% euro 1,250 million bond due January 2022 1,055 1,042 1,270 1,203 1,236 1,17 2
5.375% euro 500 million bond due June 2022 422 417 530 501 558 532
2.5% US dollar 1,000 million bond due September 2022 658 – 633 – 643 –
2.95% US dollar 1,600 million bond due February 2023 1,053 – 1,050 – 1,054 –
5.625% sterling 250 million bond due December 2025 250 250 308 294 338 324
6.6324% euro 50 million bond due December 2028 42 42 94 86 77 67
5.9% sterling 450 million bond due November 2032 450 450 560 531 598 573
4.375% US dollar 1,400 million bond due February 2043 921 – 881 – 906 –
Long-term borrowings 26,760 25,759 29,122 28,583 29,108 28,362
Fair values are calculated using quoted market prices or discounted cash ows with a discount rate based upon forward interest rates available to the
Group at the reporting date.
125 Vodafone Group Plc
Annual Report 2013
Overview Business
review Performance Governance Financials Additional
information