Vodafone 2013 Annual Report Download - page 93
Download and view the complete annual report
Please find page 93 of the 2013 Vodafone annual report below. You can navigate through the pages in the report by either clicking on the pages listed below, or by using the keyword search tool below to find specific information within the annual report.-
 1
1 -
2
-
3
-
4
-
5
-
6
-
7
-
8
-
9
-
10
-
11
-
12
-
13
-
14
-
15
-
16
-
17
-
18
-
19
-
20
-
21
-
22
-
23
-
24
-
25
-
26
-
27
-
28
-
29
-
30
-
31
-
32
-
33
-
34
-
35
-
36
-
37
-
38
-
39
-
40
-
41
-
42
-
43
-
44
-
45
-
46
-
47
-
48
-
49
-
50
-
51
-
52
-
53
-
54
-
55
-
56
-
57
-
58
-
59
-
60
-
61
-
62
-
63
-
64
-
65
-
66
-
67
-
68
-
69
-
70
-
71
-
72
-
73
-
74
-
75
-
76
-
77
-
78
-
79
-
80
-
81
-
82
-
 83
83 -
 84
84 -
 85
85 -
 86
86 -
 87
87 -
 88
88 -
 89
89 -
 90
90 -
 91
91 -
 92
92 -
 93
93 -
 94
94 -
 95
95 -
 96
96 -
 97
97 -
 98
98 -
 99
99 -
 100
100 -
 101
101 -
 102
102 -
 103
103 -
104
-
105
-
106
-
107
-
108
-
109
-
110
-
111
-
112
-
113
-
114
-
115
-
116
-
117
-
118
-
119
-
120
-
121
-
122
-
123
-
124
-
125
-
126
-
127
-
128
-
129
-
130
-
131
-
132
-
133
-
134
-
135
-
136
-
137
-
138
-
139
-
140
-
141
-
142
-
143
-
144
-
145
-
146
-
147
-
148
-
149
-
150
-
151
-
152
-
153
-
154
-
155
-
156
-
157
-
158
-
159
-
160
-
161
-
162
-
163
-
164
-
165
-
166
-
167
-
168
-
169
-
170
-
171
-
172
-
173
-
174
-
175
-
176
-
177
-
178
-
179
-
180
-
181
-
182
-
183
-
184
-
185
-
186
-
187
-
188
-
189
-
190
-
191
-
192
 |
 |

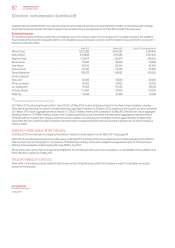
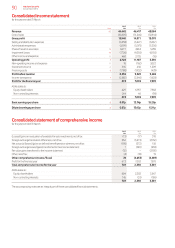
Commentary on the consolidated income statement
and statement of comprehensive income
The consolidated income statement includes the
majority of our income and expenses for the year
with the remainder recorded in the statement
of comprehensive income.
Further details on the major movements in the year are set out below:
Revenue
Revenue fell by 4.2% to £44.4 billion. The decrease was primarily due
to the negative impact of adverse foreign exchange rate movements,
as much of the Group’s revenue is generated in currencies other than
sterling, and the challenging economic conditions in southern Europe.
Our operating results on pages 40 to 44 explain in more detail the
geographical split of our revenue.
Share of result in associates
Share of results in associates increased 30.5% to £6.5 billion.
Thisis primarily due to the strong performance of VZW, in which
we have a 45% interest. For more information on what has driven
thegrowth at VZW, see page 44.
Impairment losses
An impairment loss of £7.7 billion was recorded in relation to Italy and
Spain, primarily driven by adverse performance against previous plans
and adverse movements in discount rates. Note 12 provides more
information on how we test for impairment.
Other income and expense
Other income and expense has decreased from a gain of £3.7 billion
in the prior year to a gain of £0.5 billion this year. The decrease
is primarily due to the £3.7 billion gain on disposal of the Group’s 44%
interest in SFR and 24.4% interest in Polkomtel recognised in the prior
year, whereas in the current year we recognised a gain on acquisition
of CWW of £0.5 billion. Note 11 provides more information on our
acquisitions and disposals.
Income tax expense
Our income tax expense was stable at £2.6 billion. Our adjusted effective
tax rate, a non-GAAP measure used by management to measure the
rate of tax on our adjusted prot before tax, continued to be in the
mid-twenties range and is calculated as set out below.
2013 2012
£m £m
Income tax expense 2,582 2,546
Tax on adjustments to derive adjusted
prot before tax 12 (242)
Adjusted income tax expense 2,594 2,304
Share of associates’ tax 11 302
Adjusted income tax expense for
calculating adjusted tax rate 2,605 2,606
Prot before tax 3,255 9,549
Adjustments to derive adjusted prot
before tax17,273 369
Adjusted prot before tax 10,528 9,918
Add: Share of associates’ tax and
non-controlling interest 105 382
Adjusted prot before tax for
calculating adjusted effective
taxrate 10,633 10,300
Adjusted effective tax rate 24.5% 25.3%
Note:
1 See “Earnings per share” opposite.
The Group’s share of associates’ tax has fallen as a result of a greater
share of the VZW prots being taxed at the partnership level.
Earnings per share
Basic earnings per share was 0.87 pence, a reduction of 12.87 pence
from the prior year. This was driven by higher impairment losses in the
current year, whilst the prior year beneted from a gain on disposal
of our 44% interest in SFR and 24.4% interest in Polkomtel.
Adjusted earnings per share, which is a non-GAAP measure used
by management and which excludes the one-off items noted above
together with items that we do not view as being reective of our
performance, was 15.65 pence, an increase of 5.0% compared to the
prior year. The increase was primarily due to an increase in earnings
on higher adjusted operating prot. Our calculation of the adjusted
earnings on which we base our adjusted earnings per share calculation
is set out below. Note 8 provides information on the number of shares.
2013 2012
£m £m
Prot attributable to equity
shareholders 429 6,957
Pre-tax adjustments:
Impairment loss 7,700 4,050
Other income and expense1(468) (3,705)
Non-operating income and expense (10) 162
Investment income and nancing costs 51 (138)
7,273 369
Taxation2(12) 242
Non-controlling interests 6(18)
Adjusted prot attributable
to equityshareholders 7,696 7,550
Notes:
1 Other income and expense for the year ended 31 March 2013 included a £473 million gain on acquisition
of CWW. The year ended 31 March 2012 included a £3,419 million gain on disposal of the Group’s 44%
interest in SFR and a £296 million gain on disposal of the Group’s 24.4% interest in Polkomtel.
2 Taxation for the year ended 31 March 2012 included a £206 million charge in respect of the disposal of the
Group’s 24.4% interest in Polkomtel. The gain arising on our acquisition of CWW in the year ended 31 March
2013 and the disposal of our 44% interest in SFR in the 2012 nancial year did not give rise to a tax charge.
The impairment charges of £7,700 million and £4,050 million in the years ended 31 March 2013 and 2012
respectively did not result in any tax consequences.
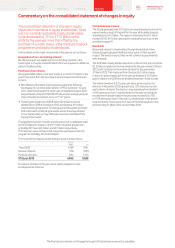
The consolidated statement of comprehensive
income records all of the income and losses
generated for the year. Total comprehensive income
was over £0.7 billion, comprising a prot of £0.7 billion
and other comprehensive income of £0.1 billion.
Further details on the major movements in the year are set out below:
Foreign exchange differences, net of tax
Foreign exchange translation differences arise when we translate the
results and net assets of our operating companies and associates,
which transact their operations in foreign currencies including the euro,
South African rand and Indian rupee, as well as US dollars for VZW, into
our presentation currency of sterling. The net movement in foreign
exchange rates resulted in a gain of £0.4 billion for the year. In the prior
year there was a loss of £3.7 billion.
Net actuarial (losses)/gains on dened benet schemes
We incurred a loss of £0.2 billion from the revaluation of the
Group’s dened benet pension schemes after comparing the
outcomes to those anticipated by the Group’s actuary. In the prior year
there was a loss of £0.3 billion.
Foreign exchange losses/(gains) transferred to the
income statement
The prior year gains were a result of the recycling of foreign exchange
losses on the disposal of our investments in SFR and Polkomtel.
Prot for the nancial year
The reasons underlying the £6.3 billion decrease in prot for the
nancial year are provided above.
The nancial commentary on this page forms part of the business review and is unaudited.
91 Vodafone Group Plc
Annual Report 2013
Overview Business
review Performance Governance Financials Additional
information