Vodafone 2013 Annual Report Download - page 145
Download and view the complete annual report
Please find page 145 of the 2013 Vodafone annual report below. You can navigate through the pages in the report by either clicking on the pages listed below, or by using the keyword search tool below to find specific information within the annual report.-
 1
1 -
2
-
3
-
4
-
5
-
6
-
7
-
8
-
9
-
10
-
11
-
12
-
13
-
14
-
15
-
16
-
17
-
18
-
19
-
20
-
21
-
22
-
23
-
24
-
25
-
26
-
27
-
28
-
29
-
30
-
31
-
32
-
33
-
34
-
35
-
36
-
37
-
38
-
39
-
40
-
41
-
42
-
43
-
44
-
45
-
46
-
47
-
48
-
49
-
50
-
51
-
52
-
53
-
54
-
55
-
56
-
57
-
58
-
59
-
60
-
61
-
62
-
63
-
64
-
65
-
66
-
67
-
68
-
69
-
70
-
71
-
72
-
73
-
74
-
75
-
76
-
77
-
78
-
79
-
80
-
81
-
82
-
83
-
84
-
85
-
86
-
87
-
88
-
89
-
90
-
91
-
92
-
93
-
94
-
95
-
96
-
97
-
98
-
99
-
100
-
101
-
102
-
103
-
104
-
105
-
106
-
107
-
108
-
109
-
110
-
111
-
112
-
113
-
114
-
115
-
116
-
117
-
118
-
119
-
120
-
121
-
122
-
123
-
124
-
125
-
126
-
127
-
128
-
129
-
130
-
131
-
132
-
133
-
134
-
 135
135 -
 136
136 -
 137
137 -
 138
138 -
 139
139 -
 140
140 -
 141
141 -
 142
142 -
 143
143 -
 144
144 -
 145
145 -
 146
146 -
 147
147 -
 148
148 -
 149
149 -
 150
150 -
 151
151 -
 152
152 -
 153
153 -
 154
154 -
 155
155 -
156
-
157
-
158
-
159
-
160
-
161
-
162
-
163
-
164
-
165
-
166
-
167
-
168
-
169
-
170
-
171
-
172
-
173
-
174
-
175
-
176
-
177
-
178
-
179
-
180
-
181
-
182
-
183
-
184
-
185
-
186
-
187
-
188
-
189
-
190
-
191
-
192
 |
 |
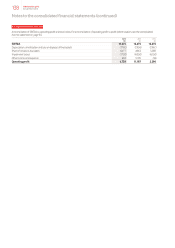
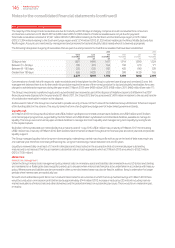
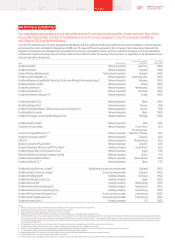
Charges made to the consolidated income statement and consolidated statement of comprehensive income (‘SOCI’) on the basis of the
assumptions stated above are:
2013 2012 2011
£m £m £m
Current service cost 28 11 12
Interest cost 139 85 95
Expected return on pension assets (146) (99) (103)
Curtailment/settlement (1) 1 –
Total included within staff costs 20 (2) 4
Actuarial losses/(gains) recognised in the SOCI 259 365 (190)
Cumulative actuarial losses recognised in the SOCI 930 671 306
Fair value of the assets and present value of the liabilities of the schemes
The amount included in the statement of nancial position arising from the Group’s obligations in respect of its dened benet schemes is as follows:
2013 2012 2011
£m £m £m
Movement in pension assets:
1 April 1,604 1,558 1,487
Exchange rate movements 6 (22) (2)
Expected return on pension assets 146 99 103
Actuarial gains/(losses) 189 (30) (6)
Employer cash contributions 103 34 24
Member cash contributions 8 6 5
Benets paid (63) (42) (51)
Other movements11,730 1 (2)
31 March 3,723 1,604 1,558
Movement in pension liabilities:
1 April 1,910 1,548 1,690
Exchange rate movements 9 (33) (4)
Current service cost 28 11 12
Interest cost 139 85 95
Member cash contributions 8 6 5
Actuarial losses/(gains) 448 335 (196)
Benets paid (63) (42) (51)
Other movements11,821 – (3)
31 March 4,300 1,910 1,548
Note:
1 Other movements mainly comprise the addition of the CWWRP as a result of the acquisition of CWW (see note 11).
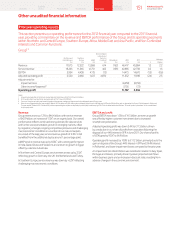
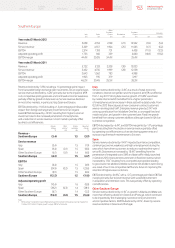
An analysis of net (decit)/assets is provided below for the Group’s two largest dened benet pension scheme in the UK and for the Group
as a whole.
CWWRP Vodafone UK plan Group
2013 2013 2012 2011 2010 2009 2013 2012 2011 2010 2009
£m £m £m £m £m £m £m £m £m £m £m
Analysis of net
(decit)/assets:
Total fair value of scheme assets 1,827 1,328 1,218 1,180 1,131 755 3,723 1,604 1,558 1,487 1,100
Present value of funded
schemeliabilities (1,874) (1,647) (1,444) (1,127) (1,276) (815) (4,238) (1,852) (1,488) (1,625) (1,196)
Net (deficit)/assets for
funded schemes (47) (319) (226) 53 (145) (60) (515) (248) 70 (138) (96)
Present value of unfunded
scheme liabilities – – – – – (8) (62) (58) (60) (65) (136)
Net (decit)/assets (47) (319) (226) 53 (145) (68) (577) (306) 10 (203) (232)
Net (decit)/assets are
analysed as:
Assets – – – 53 – – 52 31 97 34 8
Liabilities (47) (319) (226) – (145) (68) (629) (337) (87) (237) (240)
It is expected that contributions of £62 million will be paid into the Group’s dened benet retirement schemes during the year ending 31 March 2014.
The assets of the schemes are held in external trustee administered funds.
143 Vodafone Group Plc
Annual Report 2013
Overview Business
review Performance Governance Financials Additional
information