Vodafone 2013 Annual Report Download - page 44
Download and view the complete annual report
Please find page 44 of the 2013 Vodafone annual report below. You can navigate through the pages in the report by either clicking on the pages listed below, or by using the keyword search tool below to find specific information within the annual report.-
 1
1 -
2
-
3
-
4
-
5
-
6
-
7
-
8
-
9
-
10
-
11
-
12
-
13
-
14
-
15
-
16
-
17
-
18
-
19
-
20
-
21
-
22
-
23
-
24
-
25
-
26
-
27
-
28
-
29
-
30
-
31
-
32
-
33
-
 34
34 -
 35
35 -
 36
36 -
 37
37 -
 38
38 -
 39
39 -
 40
40 -
 41
41 -
 42
42 -
 43
43 -
 44
44 -
 45
45 -
 46
46 -
 47
47 -
 48
48 -
 49
49 -
 50
50 -
 51
51 -
 52
52 -
 53
53 -
 54
54 -
55
-
56
-
57
-
58
-
59
-
60
-
61
-
62
-
63
-
64
-
65
-
66
-
67
-
68
-
69
-
70
-
71
-
72
-
73
-
74
-
75
-
76
-
77
-
78
-
79
-
80
-
81
-
82
-
83
-
84
-
85
-
86
-
87
-
88
-
89
-
90
-
91
-
92
-
93
-
94
-
95
-
96
-
97
-
98
-
99
-
100
-
101
-
102
-
103
-
104
-
105
-
106
-
107
-
108
-
109
-
110
-
111
-
112
-
113
-
114
-
115
-
116
-
117
-
118
-
119
-
120
-
121
-
122
-
123
-
124
-
125
-
126
-
127
-
128
-
129
-
130
-
131
-
132
-
133
-
134
-
135
-
136
-
137
-
138
-
139
-
140
-
141
-
142
-
143
-
144
-
145
-
146
-
147
-
148
-
149
-
150
-
151
-
152
-
153
-
154
-
155
-
156
-
157
-
158
-
159
-
160
-
161
-
162
-
163
-
164
-
165
-
166
-
167
-
168
-
169
-
170
-
171
-
172
-
173
-
174
-
175
-
176
-
177
-
178
-
179
-
180
-
181
-
182
-
183
-
184
-
185
-
186
-
187
-
188
-
189
-
190
-
191
-
192
 |
 |

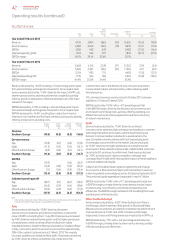
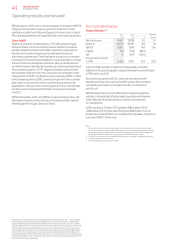
Revenue decreased by -16.0% including a -5.0 percentage point impact
from adverse foreign exchange rate movements. On an organic basis
service revenue declined by -11.6%*, driven by the impact of MTR cuts,
severe macroeconomic weakness and intense competition, partially
offset by growth in data revenue. Revenue declined in all of the major
markets in the region.
EBITDA declined by -21.5%, including a -4.9 percentage point impact
from adverse foreign exchange rate movements. On an organic basis
EBITDA decreased by -16.4%*, resulting from a reduction in service
revenue in most markets and the impact of restructuring costs, partially
offset by a reduction in operating costs.
Organic
change
%
Other
activity1
pps
Foreign
exchange
pps
Reported
change
%
Revenue –
Southern Europe (10.8) (0.2) (5.0) (16.0)
Service revenue
Italy (12.8) (0.1) (4.9) (17.8)
Spain (11.5) (0.2) (5.0) (16.7)
Other Southern Europe (8.2) (0.4) (5.1) (13.7)
Southern Europe (11.6) (0.1) (5.0) (16.7)
EBITDA
Italy (19.5) – (4.6) (24.1)
Spain (15.4) (0.6) (5.0) (21.0)
Other Southern Europe (7.1) (0.4) (5.9) (13.4)
Southern Europe (16.4) (0.2) (4.9) (21.5)
Adjusted operating prot
Italy (28.7) (0.1) (4.2) (33.0)
Spain (34.3) (0.9) (4.4) (39.6)
Other Southern Europe (10.4) (0.9) (6.0) (17.3)
Southern Europe (27.5) (0.3) (4.5) (32.3)
Note:
1 “Other activity” includes the impact of M&A activity and the revision to intra-group roaming charges from
1October 2011. Refer to “Organic growth” on page 188 for further detail.
Italy
Service revenue declined by -12.8%* driven by the severe
macroeconomic weakness and intense competition, as well as the
impact of MTR cuts starting from 1 July 2012. Data revenue increased
by 4.4%* driven by mobile internet growth and the higher penetration
of smartphones, which more than offset the decline in mobile
broadband revenue. Vodafone Red plans, branded as “Vodafone Relax”
in Italy, continued to perform well and now account for approximately
30% of the contract customer base at 31 March 2013. The majority
of contract additions are Vodafone Relax tariffs. Fixed revenue declined
by -6.8%* driven by intense competition and a reduction in the
customer base due to the decision to stop consumer acquisitions
in areas where margins are impacted by unfavourable regulated
wholesale prices.
LTE commercial services were launched in October 2012 and were
available in 21 cities at 31 March 2013.
EBITDA declined by -19.5%*, with a -4.3* percentage point fall
in the EBITDA margin, driven by the decline in service revenue and
an increase in commercial costs, partially offset by operating cost
efciencies such as site sharing agreements and the outsourcing
of network maintenance.
Spain
Service revenue declined by -11.5%* driven by continued
macroeconomic weakness, high unemployment leading to customers
optimising their spend, and a lower customer base following our
decision to remove handset subsidies for a period earlier in the
year. Competition remains intense with the increased popularity
of converged consumer offers in the market. Data revenue grew
by 16.5%* driven by the higher penetration of smartphones and
an increase in those sold with a data bundle. Vodafone Red, which was
launched in Q3, continues to perform well. Fixed revenue declined
by -2.9%*, primarily due to intense competition, although new
converged xed/mobile tariffs had a positive impact on xed broadband
customer additions during Q4.
In March 2013 Vodafone Spain signed an agreement with Orange
to co-invest in a bre network in Spain, with the intention to reach six
million households and workplaces across 50 cities by September 2017.
The combined capital expenditure is expected to reach €1 billion.
EBITDA declined by -15.4%*, with a -0.7* percentage point reduction
in EBITDA margin, primarily driven by lower revenue and the impact
of restructuring costs offset by commercial and operating cost
efciencies. The EBITDA margin stabilised in H2, beneting from lower
operating and commercial costs.
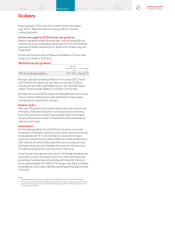
Other Southern Europe
Service revenue declined by -8.2%*, driven by declines in Greece
and Portugal, which more than offset growth in Albania and Malta.
Macroeconomic weakness and intense competition resulted in service
revenue declines of -13.4%* and -8.2%* in Greece and Portugal,
respectively. Greece and Portugal were also impacted by an MTR cut.
EBITDA declined by -7.1%*, with a -0.4* percentage point reduction
in EBITDA margin, primarily driven by lower service revenue, partially
offset by operating cost efciencies.
Southern Europe
Italy
£m
Spain
£m
Other
Southern
Europe
£m
Eliminations
£m
Southern
Europe
£m
% change
£m Organic
Year ended 31 March 2013
Revenue 4,755 3,904 1,883 (20) 10,522 (16.0) (10.8)
Service revenue 4,380 3,629 1,644 (18) 9,635 (16.7) (11.6)
EBITDA 1,908 942 633 – 3,483 (21.5) (16.4)
Adjusted operating prot 1,163 342 297 – 1,802 (32.3) (27.5)
EBITDA margin 40.1% 24.1% 33.6% 33.1%
Year ended 31 March 2012
Revenue 5,658 4,763 2,128 (27) 12,522 (3.9) (5.4)
Service revenue 5,329 4,357 1,904 (25) 11,565 (4.7) (6.2)
EBITDA 2,514 1,193 731 –4,438 (11.0) (12.5)
Adjusted operating prot 1,735 566 359 –2,660 (16.8) (18.2)
EBITDA margin 44.4% 25.0% 34.4% 35.4%
Operating results (continued)
42 Vodafone Group Plc
Annual Report 2013