Vodafone 2013 Annual Report Download - page 108
Download and view the complete annual report
Please find page 108 of the 2013 Vodafone annual report below. You can navigate through the pages in the report by either clicking on the pages listed below, or by using the keyword search tool below to find specific information within the annual report.-
 1
1 -
2
-
3
-
4
-
5
-
6
-
7
-
8
-
9
-
10
-
11
-
12
-
13
-
14
-
15
-
16
-
17
-
18
-
19
-
20
-
21
-
22
-
23
-
24
-
25
-
26
-
27
-
28
-
29
-
30
-
31
-
32
-
33
-
34
-
35
-
36
-
37
-
38
-
39
-
40
-
41
-
42
-
43
-
44
-
45
-
46
-
47
-
48
-
49
-
50
-
51
-
52
-
53
-
54
-
55
-
56
-
57
-
58
-
59
-
60
-
61
-
62
-
63
-
64
-
65
-
66
-
67
-
68
-
69
-
70
-
71
-
72
-
73
-
74
-
75
-
76
-
77
-
78
-
79
-
80
-
81
-
82
-
83
-
84
-
85
-
86
-
87
-
88
-
89
-
90
-
91
-
92
-
93
-
94
-
95
-
96
-
97
-
 98
98 -
 99
99 -
 100
100 -
 101
101 -
 102
102 -
 103
103 -
 104
104 -
 105
105 -
 106
106 -
 107
107 -
 108
108 -
 109
109 -
 110
110 -
 111
111 -
 112
112 -
 113
113 -
 114
114 -
 115
115 -
 116
116 -
 117
117 -
 118
118 -
119
-
120
-
121
-
122
-
123
-
124
-
125
-
126
-
127
-
128
-
129
-
130
-
131
-
132
-
133
-
134
-
135
-
136
-
137
-
138
-
139
-
140
-
141
-
142
-
143
-
144
-
145
-
146
-
147
-
148
-
149
-
150
-
151
-
152
-
153
-
154
-
155
-
156
-
157
-
158
-
159
-
160
-
161
-
162
-
163
-
164
-
165
-
166
-
167
-
168
-
169
-
170
-
171
-
172
-
173
-
174
-
175
-
176
-
177
-
178
-
179
-
180
-
181
-
182
-
183
-
184
-
185
-
186
-
187
-
188
-
189
-
190
-
191
-
192
 |
 |
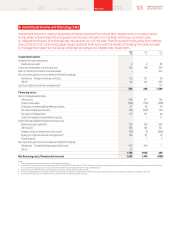
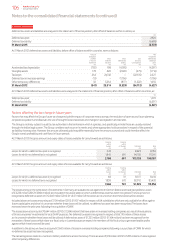
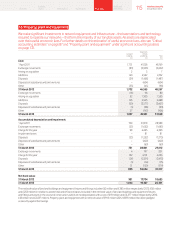
7. Taxation (continued)
Deferred tax assets and liabilities are analysed in the statement of nancial position, after offset of balances within countries, as:
£m
Deferred tax asset 2,920
Deferred tax liability (6,698)
31 March 2013 (3,778)
At 31 March 2012 deferred tax assets and liabilities, before offset of balances within countries, were as follows:
Amount Net
(charged)/ recognised
credited Gross Gross Less deferred tax
in income deferred deferred tax amounts (liability)/
statement tax asset liability unrecognised asset
£m £m £m £m £m
Accelerated tax depreciation (792) 198 (4,595) – (4,397)
Intangible assets 178 620 (2,061) (275) (1,716)
Tax losses 254 24,742 – (22,515) 2,227
Deferred tax on overseas earnings (13) – (1,796) – (1,796)
Other temporary differences 32 3,254 (877) (1,322) 1,055
31 March 2012 (341) 28,814 (9,329) (24,112) (4,627)
At 31 March 2012 deferred tax assets and liabilities were analysed in the statement of nancial position, after offset of balances within countries, as:
£m
Deferred tax asset 1,970
Deferred tax liability (6,597)
31 March 2012 (4,627)
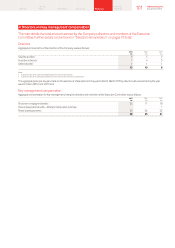
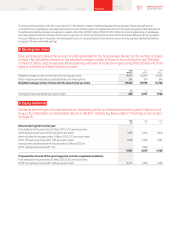
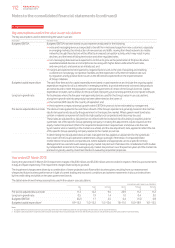
Factors affecting the tax charge in future years
Factors that may affect the Group’s future tax charge include the impact of corporate restructurings, the resolution of open issues, future planning,
corporate acquisitions and disposals, the use of brought forward tax losses and changes in tax legislation and tax rates.
The Group is routinely subject to audit by tax authorities in the territories in which it operates, and specically, in India these are usually resolved
through the Indian legal system. The Group considers each issue on its merits and, where appropriate, holds provisions in respect of the potential
tax liability that may arise. However, the amount ultimately paid may differ materially from the amount accrued and could therefore affect the
Group’s overall protability and cash ows in future periods.
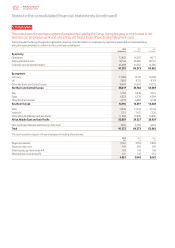
At 31 March 2013 the gross amount and expiry dates of losses available for carry forward are as follows:
Expiring Expiring
within within
5 years 6–10 years Unlimited Total
£m £m £m £m
Losses for which a deferred tax asset is recognised 343 – 8,423 8,766
Losses for which no deferred tax is recognised 1,845 691 94,705 97,241
2,188 691 103,128 106,007
At 31 March 2012 the gross amount and expiry dates of losses available for carry forward are as follows:
Expiring Expiring
within within
5 years 6–10 years Unlimited Total
£m £m £m £m
Losses for which a deferred tax asset is recognised 68 31 8,317 8,416
Losses for which no deferred tax is recognised 1,838 670 82,912 85,420
1,906 701 91,229 93,836
The losses arising on the write down of investments in Germany are available to use against both German federal and trade tax liabilities. Losses
of £3,236 million (2012: £3,804 million) are included in the above table on which a deferred tax asset has been recognised. The Group has not
recognised a deferred tax asset on £12,346 million (2012: £11,547 million) of the losses as it is uncertain that these losses will be utilised.
Included above are losses amounting to £7,104 million (2012: £1,907 million) in respect of UK subsidiaries which are only available for offset against
future capital gains and since it is uncertain whether these losses will be utilised, no deferred tax asset has been recognised. The losses have
increased since the prior year, following the acquisition of CWW.
The losses above also include £70,644 million (2012: £72,696 million) that have arisen in overseas holding companies as a result of revaluations
of those companies’ investments for local GAAP purposes. No deferred tax asset is recognised in respect of £66,110 million of these losses
as it is uncertain whether these losses will be utilised. A deferred tax asset of £1,325 million (2012: £1,164 million) has been recognised for the
remainder of these losses which relate to a scal unity in Luxembourg as we expect the members of this scal unity to generate taxable prots
against which these losses will be used.
In addition to the above, we have an acquired £7,642 million of losses in overseas holding companies following our purchase of CWW, for which
no deferred tax asset has been recognised.
The remaining losses relate to a number of other jurisdictions across the Group. There are also £5,918 million (2012: £7,283 million) of unrecognised
other temporary differences.
Notes to the consolidated nancial statements (continued)
106 Vodafone Group Plc
Annual Report 2013