Vodafone 2013 Annual Report Download - page 120
Download and view the complete annual report
Please find page 120 of the 2013 Vodafone annual report below. You can navigate through the pages in the report by either clicking on the pages listed below, or by using the keyword search tool below to find specific information within the annual report.-
 1
1 -
2
-
3
-
4
-
5
-
6
-
7
-
8
-
9
-
10
-
11
-
12
-
13
-
14
-
15
-
16
-
17
-
18
-
19
-
20
-
21
-
22
-
23
-
24
-
25
-
26
-
27
-
28
-
29
-
30
-
31
-
32
-
33
-
34
-
35
-
36
-
37
-
38
-
39
-
40
-
41
-
42
-
43
-
44
-
45
-
46
-
47
-
48
-
49
-
50
-
51
-
52
-
53
-
54
-
55
-
56
-
57
-
58
-
59
-
60
-
61
-
62
-
63
-
64
-
65
-
66
-
67
-
68
-
69
-
70
-
71
-
72
-
73
-
74
-
75
-
76
-
77
-
78
-
79
-
80
-
81
-
82
-
83
-
84
-
85
-
86
-
87
-
88
-
89
-
90
-
91
-
92
-
93
-
94
-
95
-
96
-
97
-
98
-
99
-
100
-
101
-
102
-
103
-
104
-
105
-
106
-
107
-
108
-
109
-
 110
110 -
 111
111 -
 112
112 -
 113
113 -
 114
114 -
 115
115 -
 116
116 -
 117
117 -
 118
118 -
 119
119 -
 120
120 -
 121
121 -
 122
122 -
 123
123 -
 124
124 -
 125
125 -
 126
126 -
 127
127 -
 128
128 -
 129
129 -
 130
130 -
131
-
132
-
133
-
134
-
135
-
136
-
137
-
138
-
139
-
140
-
141
-
142
-
143
-
144
-
145
-
146
-
147
-
148
-
149
-
150
-
151
-
152
-
153
-
154
-
155
-
156
-
157
-
158
-
159
-
160
-
161
-
162
-
163
-
164
-
165
-
166
-
167
-
168
-
169
-
170
-
171
-
172
-
173
-
174
-
175
-
176
-
177
-
178
-
179
-
180
-
181
-
182
-
183
-
184
-
185
-
186
-
187
-
188
-
189
-
190
-
191
-
192
 |
 |
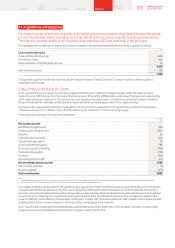
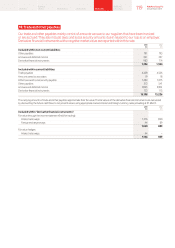
16. Other investments (continued)
2013 2012
£m £m
Included within current assets:
Public debt and bonds 1,130 900
Other debt and bonds 3,816 90
Cash held in restricted deposits 404 333
5,350 1,323
Other debt and bonds includes £3,812 million of assets held for trading which include £3,000 million (2012: £nil) of assets held in managed
investment funds with liquidity of up to 90 days, £643 million (2012: £nil) of short-term securitised investments with original maturities of up to eight
months, and collateral paid on derivative nancial instruments of £169 million (2012: £87 million).
Current public debt and bonds include government bonds of £1,076 million (2012: £900 million) which consist of highly liquid index linked gilts with
less than six years to maturity held on an effective oating rate basis.
For public debt and bonds, other debt and bonds and cash held in restricted deposits, the carrying amount approximates fair value.
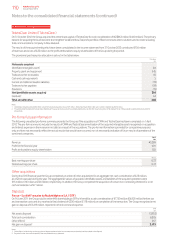
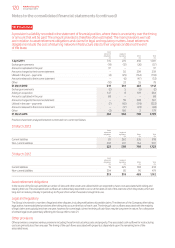
17. Trade and other receivables
Our trade and other receivables mainly consist of amounts owed to us by customers and amounts that
we pay to our suppliers in advance. Trade receivables are shown net of an allowance for bad or doubtful debts.
Derivative nancial instruments with a positive market value are reported within this note.
2013 2012
£m £m
Included within non-current assets:
Trade receivables 181 120
Other receivables 675 235
Prepayments and accrued income 502 326
Derivative nancial instruments 2,944 2,801
4,302 3,482
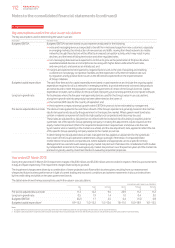
Included within current assets:
Trade receivables 3,995 3,885
Amounts owed by associates 21 15
Other receivables 1,202 2,984
Prepayments and accrued income 4,106 3,702
Derivative nancial instruments 88 158
9,412 10,744
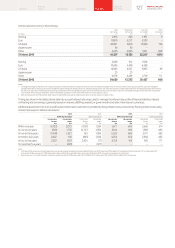
The Group’s trade receivables are stated after allowances for bad and doubtful debts based on management’s assessment of creditworthiness,
an analysis of which is asfollows:
2013 2012 2011
£m £m £m
1 April 1,014 1,006 929
Exchange movements (3) (64) (30)
Amounts charged to administrative expenses 458 458 460
Trade receivables written off (504) (386) (353)
31 March 965 1,014 1,006
The carrying amounts of trade and other receivables approximate their fair value. Trade and other receivables are predominantly
non-interest bearing.
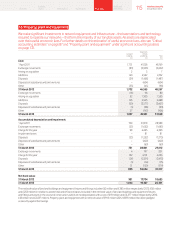
2013 2012
£m £m
Included within “Derivative nancial instruments”:
Fair value through the income statement (held for trading):
Interest rate swaps 1,508 1,196
Cross currency interest rate swaps 319 318
Foreign exchange swaps 88 128
1,915 1,642
Fair value hedges:
Interest rate swaps 1,117 1,317
3,032 2,959
The fair values of these nancial instruments are calculated by discounting the future cash ows to net present values using appropriate market
interest and foreign currency rates prevailing at 31 March.
Notes to the consolidated nancial statements (continued)
118 Vodafone Group Plc
Annual Report 2013