Vodafone 2013 Annual Report Download - page 17
Download and view the complete annual report
Please find page 17 of the 2013 Vodafone annual report below. You can navigate through the pages in the report by either clicking on the pages listed below, or by using the keyword search tool below to find specific information within the annual report.-
 1
1 -
2
-
3
-
4
-
5
-
6
-
 7
7 -
 8
8 -
 9
9 -
 10
10 -
 11
11 -
 12
12 -
 13
13 -
 14
14 -
 15
15 -
 16
16 -
 17
17 -
 18
18 -
 19
19 -
 20
20 -
 21
21 -
 22
22 -
 23
23 -
 24
24 -
 25
25 -
 26
26 -
 27
27 -
28
-
29
-
30
-
31
-
32
-
33
-
34
-
35
-
36
-
37
-
38
-
39
-
40
-
41
-
42
-
43
-
44
-
45
-
46
-
47
-
48
-
49
-
50
-
51
-
52
-
53
-
54
-
55
-
56
-
57
-
58
-
59
-
60
-
61
-
62
-
63
-
64
-
65
-
66
-
67
-
68
-
69
-
70
-
71
-
72
-
73
-
74
-
75
-
76
-
77
-
78
-
79
-
80
-
81
-
82
-
83
-
84
-
85
-
86
-
87
-
88
-
89
-
90
-
91
-
92
-
93
-
94
-
95
-
96
-
97
-
98
-
99
-
100
-
101
-
102
-
103
-
104
-
105
-
106
-
107
-
108
-
109
-
110
-
111
-
112
-
113
-
114
-
115
-
116
-
117
-
118
-
119
-
120
-
121
-
122
-
123
-
124
-
125
-
126
-
127
-
128
-
129
-
130
-
131
-
132
-
133
-
134
-
135
-
136
-
137
-
138
-
139
-
140
-
141
-
142
-
143
-
144
-
145
-
146
-
147
-
148
-
149
-
150
-
151
-
152
-
153
-
154
-
155
-
156
-
157
-
158
-
159
-
160
-
161
-
162
-
163
-
164
-
165
-
166
-
167
-
168
-
169
-
170
-
171
-
172
-
173
-
174
-
175
-
176
-
177
-
178
-
179
-
180
-
181
-
182
-
183
-
184
-
185
-
186
-
187
-
188
-
189
-
190
-
191
-
192
 |
 |

Adjusted operating prot from controlled
and jointly controlled operations, before our
share of associates’ prots, was £5.5 billion,
down -7.0%* year-on-year, reecting the
decline in EBITDA and relatively consistent
depreciation and amortisation year-on-year.
Group adjusted operating prot was up 9.3%*
year-on-year at £12.0 billion, above our
guidance range of £11.1 billion to £11.9 billion,
as a result of the strong VZW contribution,
which increased 30.5%* year-on-year.
Excluding M&A and restructuring costs,
adjusted operating prot was £12.3 billion2.
We recorded an accounting gain of £0.5 billion
on the acquisition of CWW and impairment
charges of £7.7 billion relating to our
businesses in Italy and Spain. These were
driven primarily by lower projected cash
ows within business plans, resulting from
the tougher macroeconomic environment,
and partly by an increase in discount rates.
Free cash ow was £5.6 billion, or £5.8 billion
2
excluding M&A and restructuring costs,
at the top of our guidance range of £5.3 billion
to £5.8 billion for the year. The year-on-year
decline reected the relative strength of sterling
against the euro, South African rand and Indian
rupee over the course of the year, as well
as tough trading conditions. In addition to the
free cash ow reported above, we received
an income dividend of US$3.8 billion (£2.4 billion)
from VZW, and will shortly receive a further
£2.1 billion which will be retained for general
business purposes, including spectrum costs.
Capital additions were stable at £6.3 billion,
as we continued to maintain a signicant
level of investment to extend our high speed
mobile data coverage across our existing voice
footprint. In addition, we spent £2.5 billion
during the year on acquiring and renewing
spectrum in a number of markets including
the UK, India and the Netherlands.
Adjusted earnings per share was up 5.0%
at 15.65 pence, driven by growth in adjusted
operating prot and a lower share count.
The Board is recommending a nal dividend
per share of 6.92 pence, to give total ordinary
dividends per share for the year of 10.19 pence,
up 7.0% year-on-year.
Northern and Central Europe
Organic service revenue in Northern and
Central Europe was down -0.2%* year-on-year.
Excluding the impact of regulated mobile
termination rate (‘MTR’) cuts, service revenue
was up 1.6%*. Underlying performance in the
major markets of Germany, the UK and the
Netherlands, while robust compared with our
competitors, weakened in the second half
of the year, reecting increased competition
and some macroeconomic pressure.
Turkey continued to grow very well through
strong execution.
Enterprise revenue grew 0.8%*, with
continued growth in Germany (+3.0%*)
and Turkey offsetting declines in other
markets. The accelerated integration of CWW
is proceeding successfully, and we expect
it to deliver signicant network synergies in the
UK and internationally, while also boosting our
enterprise business.
Data revenue was up 14.4%*, reecting
increased smartphone penetration –
now 35.4% in the region, up 9.1 percentage
points year-on-year – and further
take-up of integrated voice, SMS and
data plans. By the fourth quarter, 69.7%
of consumer contract revenue in the major
markets came from customers on these
integrated plans. During the year we launched
4G/LTE services in Romania.
Organic EBITDA was down -2.4%* and
the EBITDA margin fell -0.7* percentage
points. Margin improvement in Turkey, the
Netherlands and Ireland only partly offset
small declines in Germany and the UK, driven
by a lower top line, rising commercial costs and
higher restructuring costs in Germany.
Southern Europe
Organic service revenue in Southern Europe
fell -11.6%* year-on-year, as the effects
of severe macroeconomic weakness were
intensied by strong competition, and steep
cuts to MTRs in Italy and Greece. Combined
mobile and xed offers in Spain and Portugal,
from incumbents and xed operators, made
increasing inroads into the market in the
second half of the year. Excluding MTR cuts,
service revenue fell -8.4%*.
Data revenue was up 9.7%*, as demand for
data continued to grow despite the economic
and competitive pressures. Smartphone
penetration increased 7.5 percentage points
to 35.5%. During the year we launched
4G/LTE services in Italy, Greece and Portugal,
announced a partnership with Orange in Spain
to deploy bre to six million homes over the
next four years, and committed to extending
our bre network in Portugal to pass over one
million homes.
Organic EBITDA fell -16.4%* and the EBITDA
margin fell -2.2* percentage points, mainly
as a result of the steep revenue declines
across the region and restructuring costs,
offset by operating cost savings. Towards
the end of the year, we undertook signicant
redundancy programmes in Spain and Greece
to reduce operating expenses.
AMAP
Organic service revenue growth in AMAP
was 3.9%*, with continued growth in all
of our markets apart from Australia and New
Zealand. Growth in India slowed through
the year, mainly as a result of increased
consumer protection regulation and a more
stringent customer verication process,
but the competitive environment improved
and we continued to gain market share.
In Vodacom, continued strong underlying
revenue growth in our other sub-Saharan
markets offset a weaker performance
in South Africa. Despite competitive pressure
and the uncertain political environment,
service revenue in Egypt grew 3.7%*.
Australia continued to experience steep
revenue declines on the back of ongoing
service perception issues. During the year
we launched 4G/LTE services in South Africa
and New Zealand.
Organic EBITDA rose 10.3%* and the EBITDA
margin increased 1.7* percentage points,
with strong margin improvements in India
and Vodacom offsetting a sharp decline
in Australia. Ghana and Qatar also made good
margin progress on strong revenue growth
and market share gains. Egypt’s margin
improved 1.4* percentage points.
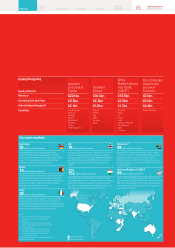
Service revenue growth 2013
It has been a difficult year in our controlled and jointly
controlled operations due to tough economic and
regulatory conditions particularly impacting our
European business. However we continue to see good
growth in key areas of data and emerging markets.
Service revenue by type 2013
£7.9bn
invested in spectrum in the last four
years, to provide 4G services and improve
the quality of our networks.
10. 19 pence
total ordinary dividends for the year,
up 7% year-on-year inlinewith
ourtarget.
Voice:
55%
Data:
16%
Fixed:
11%
Other:
6%
Messaging:
12%
Group -1.9%*
+13.8%*
+8.4%*
Data
Emerging markets
15 Vodafone Group Plc
Annual Report 2013
Overview Business
review Performance Governance Financials Additional
information