Vodafone 2013 Annual Report Download - page 148
Download and view the complete annual report
Please find page 148 of the 2013 Vodafone annual report below. You can navigate through the pages in the report by either clicking on the pages listed below, or by using the keyword search tool below to find specific information within the annual report.-
 1
1 -
2
-
3
-
4
-
5
-
6
-
7
-
8
-
9
-
10
-
11
-
12
-
13
-
14
-
15
-
16
-
17
-
18
-
19
-
20
-
21
-
22
-
23
-
24
-
25
-
26
-
27
-
28
-
29
-
30
-
31
-
32
-
33
-
34
-
35
-
36
-
37
-
38
-
39
-
40
-
41
-
42
-
43
-
44
-
45
-
46
-
47
-
48
-
49
-
50
-
51
-
52
-
53
-
54
-
55
-
56
-
57
-
58
-
59
-
60
-
61
-
62
-
63
-
64
-
65
-
66
-
67
-
68
-
69
-
70
-
71
-
72
-
73
-
74
-
75
-
76
-
77
-
78
-
79
-
80
-
81
-
82
-
83
-
84
-
85
-
86
-
87
-
88
-
89
-
90
-
91
-
92
-
93
-
94
-
95
-
96
-
97
-
98
-
99
-
100
-
101
-
102
-
103
-
104
-
105
-
106
-
107
-
108
-
109
-
110
-
111
-
112
-
113
-
114
-
115
-
116
-
117
-
118
-
119
-
120
-
121
-
122
-
123
-
124
-
125
-
126
-
127
-
128
-
129
-
130
-
131
-
132
-
133
-
134
-
135
-
136
-
137
-
 138
138 -
 139
139 -
 140
140 -
 141
141 -
 142
142 -
 143
143 -
 144
144 -
 145
145 -
 146
146 -
 147
147 -
 148
148 -
 149
149 -
 150
150 -
 151
151 -
 152
152 -
 153
153 -
 154
154 -
 155
155 -
 156
156 -
 157
157 -
 158
158 -
159
-
160
-
161
-
162
-
163
-
164
-
165
-
166
-
167
-
168
-
169
-
170
-
171
-
172
-
173
-
174
-
175
-
176
-
177
-
178
-
179
-
180
-
181
-
182
-
183
-
184
-
185
-
186
-
187
-
188
-
189
-
190
-
191
-
192
 |
 |
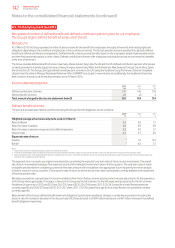
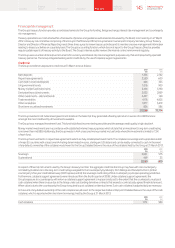
A6. Capital and nancial risk management (continued)
The majority of the Group’s trade receivables are due for maturity within 90 days and largely comprise amounts receivable from consumers
and business customers. At 31 March 2013 £2,200 million (2012: £1,806 million) of trade receivables were not yet due for payment.
Totaltradereceivables consisted of £1,547 million (2012: £1,288 million) relating to the Northern and Central Europe region, £1,415 million
(2012:£1,384 million) relating to the Southern Europe region and £1,214 million (2012: £1,333 million) relating to the Africa, Middle East and Asia
Pacic region. Accounts are monitored by management and provisions for bad and doubtful debts raised where it is deemed appropriate.
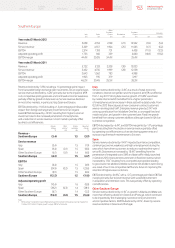
The following table presents ageing of receivables that are past due and provisions for doubtful receivables that have been established.
2013 2012
Gross
receivables
Less
provisions
Net
receivables
Gross
receivables
Less
provisions
Net
receivables
£m £m £m £m £m £m
30 days or less 1,821 (404) 1,417 1,914 (390) 1,524
Between 31–60 days 185 (21) 164 192 (21) 171
Between 61–180 days 235 (53) 182 435 (96) 339
Greater than 180 days 636 (423) 213 598 (433) 165
2,877 (901) 1,976 3,139 (940) 2,199
Concentrations of credit risk with respect to trade receivables are limited given that the Group’s customer base is large and unrelated. Due to this
management believes there is no further credit risk provision required in excess of the normal provision for bad and doubtful receivables. Amounts
charged to administrative expenses duringthe year ended 31 March 2013 were £458 million (2012: £458 million; 2011: £460 million) (see note 17).
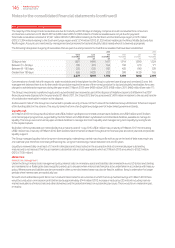
The Group’s investments in preferred equity and a subordinated loan received as part of the disposal of Vodafone Japan to SoftBank in the 2007
nancial year were disposed of in the year ended 31 March 2011. On 2 April 2012 the Group received £1,499 million in relation to the second tranche
of consideration receivable in relation to the disposal.
As discussed in note 21 the Group has covenanted to provide security in favour of the Trustee of the Vodafone Group UK Pension Scheme in respect
of the funding decit in the scheme. The security takes the form of an English law pledge over UK index linked government bonds.
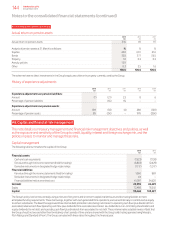
Liquidity risk
At 31 March 2013 the Group had €4.2 billion and US$4.2 billion syndicated committed undrawn bank facilities and US$15 billion and £5 billion
commercial paper programmes, supported by the €4.2 billion and US$4.2 billion syndicated committed bank facilities, available to manage its
liquidity. The Group uses commercial paper and bank facilities to manage short-term liquidity and manages long-term liquidity by raising funds
in the capital markets.
€4.2 billion of the syndicated committed facility has a maturity date of 1 July 2015. US$4.1 billion has a maturity of 9 March 2017; the remaining
US$0.1 billion has a maturity of 9 March 2016. Both facilities have remained undrawn throughout the nancial year and since year end and provide
liquidity support.
The Group manages liquidity risk on long-term borrowings by maintaining a varied maturity prole with a cap on the level of debt maturing in any
one calendar year, therefore minimising renancing risk. Long-term borrowings mature between one and 30 years.
Liquidity is reviewed daily on at least a 12 month rolling basis and stress tested on the assumption that all commercial paper outstanding
matures and is not reissued. The Group maintains substantial cash and cash equivalents which at 31 March 2013 amounted to £7,623 million
(2012:£7,138 million).
Market risk
Interest rate management
Under the Group’s interest rate management policy, interest rates on monetary assets and liabilities denominated in euros, US dollars and sterling
are maintained ona oating rate basis except for periods up to six years where interest rate xing has to be undertaken in accordance with treasury
policy. Where assets and liabilities are denominated in other currencies interest rates may also be xed.Inaddition, xing is undertaken for longer
periods when interest rates are statistically low.
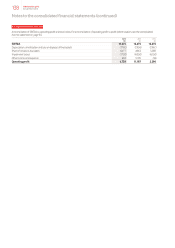
For each one hundred basis point fall or rise in market interest rates for all currencies in which the Group had borrowings at 31 March 2013 there
would be a reduction or increase in prot before tax by approximately £144 million (2012: increase or reduce by £33 million) including mark-to-
market revaluations of interest rate and other derivatives and the potential interest on outstanding tax issues. There would be no material impact
on equity.
Notes to the consolidated nancial statements (continued)
146 Vodafone Group Plc
Annual Report 2013