Vodafone 2013 Annual Report Download - page 95
Download and view the complete annual report
Please find page 95 of the 2013 Vodafone annual report below. You can navigate through the pages in the report by either clicking on the pages listed below, or by using the keyword search tool below to find specific information within the annual report.-
 1
1 -
2
-
3
-
4
-
5
-
6
-
7
-
8
-
9
-
10
-
11
-
12
-
13
-
14
-
15
-
16
-
17
-
18
-
19
-
20
-
21
-
22
-
23
-
24
-
25
-
26
-
27
-
28
-
29
-
30
-
31
-
32
-
33
-
34
-
35
-
36
-
37
-
38
-
39
-
40
-
41
-
42
-
43
-
44
-
45
-
46
-
47
-
48
-
49
-
50
-
51
-
52
-
53
-
54
-
55
-
56
-
57
-
58
-
59
-
60
-
61
-
62
-
63
-
64
-
65
-
66
-
67
-
68
-
69
-
70
-
71
-
72
-
73
-
74
-
75
-
76
-
77
-
78
-
79
-
80
-
81
-
82
-
83
-
84
-
 85
85 -
 86
86 -
 87
87 -
 88
88 -
 89
89 -
 90
90 -
 91
91 -
 92
92 -
 93
93 -
 94
94 -
 95
95 -
 96
96 -
 97
97 -
 98
98 -
 99
99 -
 100
100 -
 101
101 -
 102
102 -
 103
103 -
 104
104 -
 105
105 -
106
-
107
-
108
-
109
-
110
-
111
-
112
-
113
-
114
-
115
-
116
-
117
-
118
-
119
-
120
-
121
-
122
-
123
-
124
-
125
-
126
-
127
-
128
-
129
-
130
-
131
-
132
-
133
-
134
-
135
-
136
-
137
-
138
-
139
-
140
-
141
-
142
-
143
-
144
-
145
-
146
-
147
-
148
-
149
-
150
-
151
-
152
-
153
-
154
-
155
-
156
-
157
-
158
-
159
-
160
-
161
-
162
-
163
-
164
-
165
-
166
-
167
-
168
-
169
-
170
-
171
-
172
-
173
-
174
-
175
-
176
-
177
-
178
-
179
-
180
-
181
-
182
-
183
-
184
-
185
-
186
-
187
-
188
-
189
-
190
-
191
-
192
 |
 |

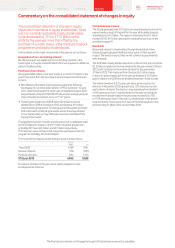
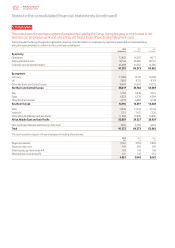
Commentary on the consolidated statement of nancial position
The consolidated statement of nancial position
shows all of our assets and liabilities at 31 March.
Total assets increased by 2.2% to £142.7 billion
driven by the increase in the carrying value of our
45% interest in VZW and higher cash and investment
balances following our bond issues during the year,
partially offset by the goodwill impairments recorded
for Italy and Spain. Total liabilities increased by 14.4%
to £70.2 billion driven by the £5.4 billion of long-term
debt issued.
Further details on the major movements in the year are set out below:
Assets
Goodwill and other intangible assets
Our intangible assets decreased to £52.4 billion (2012: £59.5 billion)
with goodwill comprising the largest element at £30.4 billion (2012:
£38.4 billion). The decrease primarily resulted from impairment losses
of £7.7 billion, amortisation of £3.4 billion and unfavourable foreign
exchange rate movements of £0.4 billion, partially offset by £4.0 billion
of additions and £0.5 billion arising on acquisitions. Further details of the
impairment loss are provided in note 12.
Property, plant and equipment
Property, plant and equipment increased to £20.3 billion (2012:
£18.7 billion) predominantly as a result of £4.7 billion of additions and
£1.6 billion arising from the acquisition of businesses, partially offset
by £4.3 billion of depreciation charges.
Investments in associates
Investments in associates increased to £38.6 billion (2012: £35.1 billion),
with VZW being our largest investment. The increase was driven by
our share of VZW’s results of £6.4 billion and £1.9 billion of favourable
exchange rate movements, partially offset by £4.8 billion of dividends
received from associates (see page 97).
Other non-current assets
Other non-current assets increased to £8.0 billion (2012: £6.3 billion)
mainly due to a £1.0 billion increase in our deferred tax asset and
an increase of £0.8 billion in trade and other receivables, both driven
by acquisitions during the year.
Current assets
Current assets increased to £23.3 billion (2012: £20.0 billion) primarily
due to a £4.5 billion increase in cash and short-term investments driven
by the £2.4 billion income dividend received from VZW in December
2012 and the £3.9 billion of bonds issued in February 2013.
Total equity and liabilities
Total equity
Total equity decreased to £72.5 billion (2012: £78.2 billion). The prot for
the year of £0.7 billion was more than offset by dividends paid to equity
shareholders and non-controlling interests of £5.2 billion and share
buybacks of £1.5 billion.
Borrowings
Borrowings increased to £41.4 billion (2012: £34.6 billion) mainly
as a result of issuing bonds, in September 2012 and February 2013,
and commercial paper. This was partially offset by the repayment
of certain borrowings which had reached maturity.
Taxation liabilities
Total tax liabilities were stable at £2.1 billion (2012: £2.1 billion).
Other current liabilities
Other current liabilities increased to £17.0 billion (2012: £15.9 billion).
Trade payables at 31 March 2013 were equivalent to 37 days (2012:
43 days) outstanding, calculated by reference to the amount owed
to suppliers as a proportion of the amounts invoiced by suppliers
during the year. It is our policy to agree terms of transactions, including
payment terms, with suppliers and it is our normal practice that
payment is made accordingly.
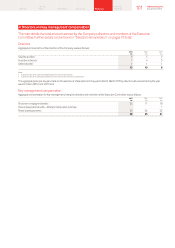
Contractual obligations and contingencies
A summary of our principal contractual nancial obligations is shown
below and details of the Group’s contingent liabilities are included
in note 21.
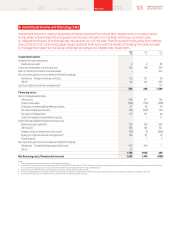
Payments due by period
£m
Contractual obligations1Total < 1 year 1–3 years 3–5 years >5 years
Borrowings250,308 13,002 11,627 8,679 17,000
Operating lease
commitments36,640 1,238 1,732 1,194 2,476
Capital
commitments3 4 1,959 1,785 159 15 –
Purchase
commitments 4,808 3,149 869 500 290
Total 63,715 19,174 14,387 10,388 19,766
Notes:
1 This table includes commitments in respect of options over interests inGroup businesses held by non-
controlling shareholders (see “Potential cash outows from option agreements and similar arrangements”
on page 158) and obligations to pay dividends to non-controlling shareholders (see “Dividends from
associates and to non-controlling shareholders” on page 158). The table excludes current and deferred
taxliabilities and obligations under post employment benet schemes, details of which are provided
in notes 7 and A5 respectively. The table also excludes the contractual obligations ofassociates.
2 See note 24.
3 See note 20.
4 Primarily related to network infrastructure.
The nancial commentary on this page forms part of the business review and is unaudited.
93 Vodafone Group Plc
Annual Report 2013
Overview Business
review Performance Governance Financials Additional
information