Vodafone 2013 Annual Report Download - page 5
Download and view the complete annual report
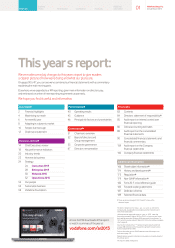
Please find page 5 of the 2013 Vodafone annual report below. You can navigate through the pages in the report by either clicking on the pages listed below, or by using the keyword search tool below to find specific information within the annual report.-
 1
1 -
 2
2 -
 3
3 -
 4
4 -
 5
5 -
 6
6 -
 7
7 -
 8
8 -
 9
9 -
 10
10 -
 11
11 -
 12
12 -
 13
13 -
 14
14 -
 15
15 -
 16
16 -
17
-
18
-
19
-
20
-
21
-
22
-
23
-
24
-
25
-
26
-
27
-
28
-
29
-
30
-
31
-
32
-
33
-
34
-
35
-
36
-
37
-
38
-
39
-
40
-
41
-
42
-
43
-
44
-
45
-
46
-
47
-
48
-
49
-
50
-
51
-
52
-
53
-
54
-
55
-
56
-
57
-
58
-
59
-
60
-
61
-
62
-
63
-
64
-
65
-
66
-
67
-
68
-
69
-
70
-
71
-
72
-
73
-
74
-
75
-
76
-
77
-
78
-
79
-
80
-
81
-
82
-
83
-
84
-
85
-
86
-
87
-
88
-
89
-
90
-
91
-
92
-
93
-
94
-
95
-
96
-
97
-
98
-
99
-
100
-
101
-
102
-
103
-
104
-
105
-
106
-
107
-
108
-
109
-
110
-
111
-
112
-
113
-
114
-
115
-
116
-
117
-
118
-
119
-
120
-
121
-
122
-
123
-
124
-
125
-
126
-
127
-
128
-
129
-
130
-
131
-
132
-
133
-
134
-
135
-
136
-
137
-
138
-
139
-
140
-
141
-
142
-
143
-
144
-
145
-
146
-
147
-
148
-
149
-
150
-
151
-
152
-
153
-
154
-
155
-
156
-
157
-
158
-
159
-
160
-
161
-
162
-
163
-
164
-
165
-
166
-
167
-
168
-
169
-
170
-
171
-
172
-
173
-
174
-
175
-
176
-
177
-
178
-
179
-
180
-
181
-
182
-
183
-
184
-
185
-
186
-
187
-
188
-
189
-
190
-
191
-
192
 |
 |

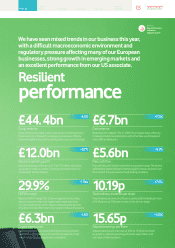
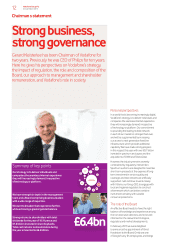
We have seen mixed trends in our business this year,
with a difcult macroeconomic environment and
regulatory pressure affecting many of our European
businesses, strong growth in emerging markets and
an excellent performance from our US associate.
Resilient
performance
More on:
Key performance
indicators
Pages 18 and 19
£44. 4bn
Group revenue
Group revenue decreased -4.2% to £44.4 billion as strong demand
for data services and growth in emerging markets were offset by
continued signicant economic and regulatory pressures in Europe.
29.9%
EBITDA margin
Reported EBITDA margin fell -1.3 percentage points. Excluding
restructuring costs and on an organic basis margin was down
-0.1* percentage points, as the impact of steep revenue declines
in Southern Europe offset improving margins in India and Vodacom.
£12.0bn
Adjusted operating prot
Adjusted operating prot wasup 3.7% at £12.0 billion, and above
our guidance range, as a result of a strong contribution from our
USassociate, Verizon Wireless.
£6.3bn
Capital expenditure
Capital expenditure was stable at £6.3 billion as we continued
to maintain a signicant level of investment to extend our high
speed mobile data coverage across our footprint.
£6.7bn
Data revenue
Data revenue increased 7.5%, or 13.8%* on an organic basis, reecting
increased smartphone penetration and further take-up of integrated
voice, SMS and data plans.
10.19p
Total ordinary dividends per share
Final dividends per share of 6.92 pence, giving total dividends per share
of 10.19 pence, up 7.0% year-on-year, in line with our target.
£5.6bn
Free cash ow
Free cash ow of £5.6 billion was within our guidance range. The decline
reected the relative strength of sterling against several currencies over
the course of the year, as well as tough trading conditions.
15.65p
Adjusted earnings per share
Adjusted earnings per share was up5.0%at15.65 pence, driven
by growth in adjusted operating prot and a lower share count
as a result of share buybacks.
-4.2%
+3.7%
-1.6%
-1.3pp
+7.5%
-8.1%
+5.0%
+7.0%
03 Vodafone Group Plc
Annual Report 2013
Overview Business
review Performance Governance Financials Additional
information