Vodafone 2013 Annual Report Download - page 72
Download and view the complete annual report
Please find page 72 of the 2013 Vodafone annual report below. You can navigate through the pages in the report by either clicking on the pages listed below, or by using the keyword search tool below to find specific information within the annual report.-
 1
1 -
2
-
3
-
4
-
5
-
6
-
7
-
8
-
9
-
10
-
11
-
12
-
13
-
14
-
15
-
16
-
17
-
18
-
19
-
20
-
21
-
22
-
23
-
24
-
25
-
26
-
27
-
28
-
29
-
30
-
31
-
32
-
33
-
34
-
35
-
36
-
37
-
38
-
39
-
40
-
41
-
42
-
43
-
44
-
45
-
46
-
47
-
48
-
49
-
50
-
51
-
52
-
53
-
54
-
55
-
56
-
57
-
58
-
59
-
60
-
61
-
 62
62 -
 63
63 -
 64
64 -
 65
65 -
 66
66 -
 67
67 -
 68
68 -
 69
69 -
 70
70 -
 71
71 -
 72
72 -
 73
73 -
 74
74 -
 75
75 -
 76
76 -
 77
77 -
 78
78 -
 79
79 -
 80
80 -
 81
81 -
 82
82 -
83
-
84
-
85
-
86
-
87
-
88
-
89
-
90
-
91
-
92
-
93
-
94
-
95
-
96
-
97
-
98
-
99
-
100
-
101
-
102
-
103
-
104
-
105
-
106
-
107
-
108
-
109
-
110
-
111
-
112
-
113
-
114
-
115
-
116
-
117
-
118
-
119
-
120
-
121
-
122
-
123
-
124
-
125
-
126
-
127
-
128
-
129
-
130
-
131
-
132
-
133
-
134
-
135
-
136
-
137
-
138
-
139
-
140
-
141
-
142
-
143
-
144
-
145
-
146
-
147
-
148
-
149
-
150
-
151
-
152
-
153
-
154
-
155
-
156
-
157
-
158
-
159
-
160
-
161
-
162
-
163
-
164
-
165
-
166
-
167
-
168
-
169
-
170
-
171
-
172
-
173
-
174
-
175
-
176
-
177
-
178
-
179
-
180
-
181
-
182
-
183
-
184
-
185
-
186
-
187
-
188
-
189
-
190
-
191
-
192
 |
 |
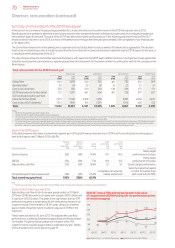
Summary of remuneration for the 2013 nancial year
In this section we summarise the pay packages awarded to our executive directors for performance in the 2013 nancial year versus 2012.
Specically we have provided a table that shows all remuneration that was earned by each individual during the year and computed a single total
remuneration gure for the year. The value of the GSTIP was earned during the year but paid out in the following year and the value of the GLTI
shows that which will vest in June 2013 as a result of the performance through the three year period ended at the completion of our nancial year
on 31 March 2013.
The Committee reviews all incentive awards prior to payment and has full discretion to reduce awards if it believes this is appropriate. The decision
need not be on objective grounds. It should be noted that the Committee did not exercise discretion in determining the GSTIP payout for this year, or
in deciding the nal vesting level of the GLTI.
The only instance where the Committee exercised discretion is with respect to the GSTIP paid to Michel Combes on his departure. It was agreed that
Vodafone would pay him a pro-rata bonus, assuming target level of achievement, for the seven months he continued to work for the company in the
nancial year.
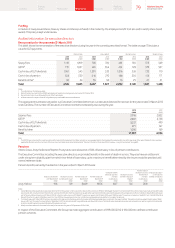
Total remuneration for the 2013 nancial year
Vittorio Colao Andy Halford Michel Combes1Stephen Pusey
2013
£’000
2012
£’000
2013
£’000
2012
£’000
2013
£’000
2012
£’000
2013
£’000
2012
£’000
Salary/fees 1,110 1,099 700 700 461 785 575 569
Benets/other230 24 35 30 16 25 21 21
Cash in lieu of pension 333 330 210 210 138 236 173 171
GSTIP (see below for further detail) 731 1,037 461 654 461 728 379 537
GLTI vesting during the year3 (see
below for further detail) 7,515 11,316 4,368 7,450 –5,861 2,404 4,227
Cash in lieu of GLTI dividends41,313 1,961 763 1,291 –1,016 420 733
Total 11,032 15,767 6,537 10,335 1,076 8,651 3,972 6,258
Notes:
1 Michel Combes was employed until 31 October 2012.
2 Includes amounts in respect of private healthcare and car allowance.
3 The value shown in the 2012 column is the award which vested on 30 June 2012 and is valued using the execution share price on 2 July 2012 of 177.29 pence. The value shown in the 2013 column is the award which vests
on 28 June 2013 and is valued using the closing share price on 31 March 2013 of 186.60 pence. Includes the vesting of an All Share award in 2012.
4 Participants also receive a cash award, equivalent in value to the dividends that would have been paid during the vesting period on any shares that vest. The cash in lieu of dividend value shown in 2012 relates to the award
which vested on 30 June 2012, and the value for 2013 relates to the award which vests on 28 June 2013. We believe this is in line with the future government guidelines issued for reporting a single gure of remuneration
per director. However, it is worth noting that this differs from how the values are reported in the audited tables on page 79, which show the values in the columns in the year they were paid.
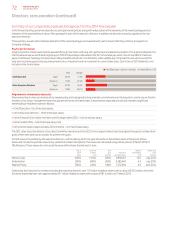
Details of the GSTIP payout
In the table below we describe our achievement against each of the performance measures in our GSTIP and the resulting total incentive payout
level for the year ended 31 March 2013 of 65.9%.
Performance measure
Payout at
target
performance
100%
Payout at
maximum
performance
200%
Actual
payout
%
Target
performance
level
£bn
Actual
performance
level1
£bn Commentary
Service revenue 25% 50% 14.4% 41.1 40.3
Below target
performance in Europe.
EBITDA 25% 50% 7.7% 14.0 13.3
Below target
performance in Europe.
Adjusted free cash ow 20% 40% 18.4% 5.7 5.7 Close to target performance.
Competitive performance assessment 30% 60% 25.4%
Compilation of market by
market assessment
Varies by market but overall
on track for market share
with more to do for NPS.
Total incentive payout level 100% 200% 65.9%
Note:
1 These gures are adjusted to include the removal of the impact of M&A, foreign exchange movements and any changes in accounting treatment.
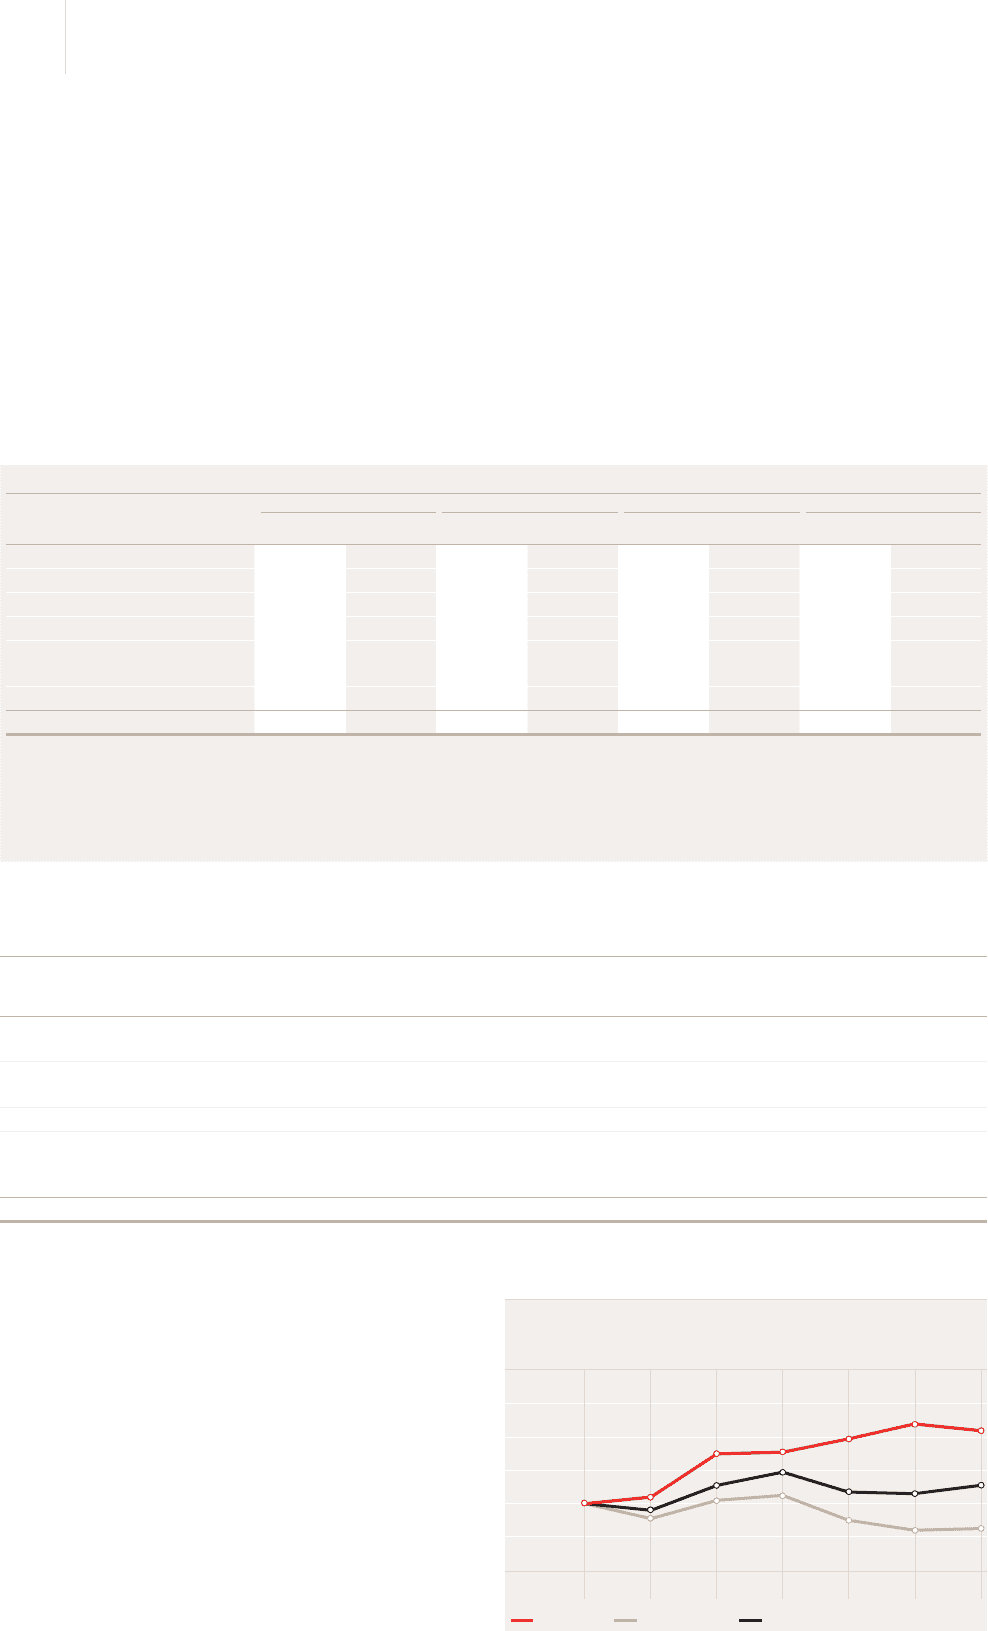
Details of the GLTI vesting in June 2013
Adjusted free cash ow for the three-year period ended on 31 March
2013 was £20.8 billion which compares with a target of £20.5 billion and
amaximum of £23.0 billion. The graph to the right shows that our TSR
performance against our peer group for the same period resulted in an
outperformance of the median by 18.3% a year. Using our combined
payout matrix, this performance resulted in a payout of 56.9% of the
maximum.
These shares will vest on 28 June 2013. The adjusted free cash ow
performance is audited by Deloitte and approved by the Remuneration
Committee. The performance assessment in respect of the TSR
outperformance of a peer group median is undertaken by pwc. Details
of how the plan works can be found on page 76.
2010 GLTI award: TSR performance (growth in the value
of a hypothetical US$100 holding over the performance period,
six month averaging)
160
140
120
100
80
60
03/10 09/10 03/11 09/11 03/12 09/12 03/13
Vodafone Group Median of peer group Outperformance of median of 9% p.a.
100
104
96
91
130
111
102
131
119
105
139
107
90
148
106
84
144
111
85
70 Vodafone Group Plc
Annual Report 2013
Directors’ remuneration (continued)