Vodafone 2013 Annual Report Download - page 105
Download and view the complete annual report
Please find page 105 of the 2013 Vodafone annual report below. You can navigate through the pages in the report by either clicking on the pages listed below, or by using the keyword search tool below to find specific information within the annual report.-
 1
1 -
2
-
3
-
4
-
5
-
6
-
7
-
8
-
9
-
10
-
11
-
12
-
13
-
14
-
15
-
16
-
17
-
18
-
19
-
20
-
21
-
22
-
23
-
24
-
25
-
26
-
27
-
28
-
29
-
30
-
31
-
32
-
33
-
34
-
35
-
36
-
37
-
38
-
39
-
40
-
41
-
42
-
43
-
44
-
45
-
46
-
47
-
48
-
49
-
50
-
51
-
52
-
53
-
54
-
55
-
56
-
57
-
58
-
59
-
60
-
61
-
62
-
63
-
64
-
65
-
66
-
67
-
68
-
69
-
70
-
71
-
72
-
73
-
74
-
75
-
76
-
77
-
78
-
79
-
80
-
81
-
82
-
83
-
84
-
85
-
86
-
87
-
88
-
89
-
90
-
91
-
92
-
93
-
94
-
 95
95 -
 96
96 -
 97
97 -
 98
98 -
 99
99 -
 100
100 -
 101
101 -
 102
102 -
 103
103 -
 104
104 -
 105
105 -
 106
106 -
 107
107 -
 108
108 -
 109
109 -
 110
110 -
 111
111 -
 112
112 -
 113
113 -
 114
114 -
 115
115 -
116
-
117
-
118
-
119
-
120
-
121
-
122
-
123
-
124
-
125
-
126
-
127
-
128
-
129
-
130
-
131
-
132
-
133
-
134
-
135
-
136
-
137
-
138
-
139
-
140
-
141
-
142
-
143
-
144
-
145
-
146
-
147
-
148
-
149
-
150
-
151
-
152
-
153
-
154
-
155
-
156
-
157
-
158
-
159
-
160
-
161
-
162
-
163
-
164
-
165
-
166
-
167
-
168
-
169
-
170
-
171
-
172
-
173
-
174
-
175
-
176
-
177
-
178
-
179
-
180
-
181
-
182
-
183
-
184
-
185
-
186
-
187
-
188
-
189
-
190
-
191
-
192
 |
 |

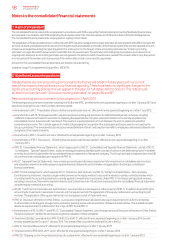
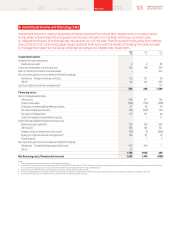
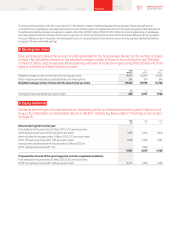
6. Investment income and nancing costs
Investment income is mainly comprised of interest received from short-term investments in money market
funds, external bank deposits and government bonds and gains from foreign exchange contracts used
to mitigate the impact of exchange rate movements on our net debt. Financing costs mainly arise from interest
due on bonds and commercial paper issued, external bank loans and the results of hedging transactions used
to manage the impact on the Group of foreign exchange and interest rate movements.
2013 2012 2011
£m £m £m
Investment income:
Available-for-sale investments:
Dividends received 2 2 83
Loans and receivables at amortised cost 124 168 339
Gain on settlement of loans and receivables1– – 472
Fair value through the income statement (held for trading):
Derivatives – foreign exchange contracts 115 121 38
Other264 165 263
Equity put rights and similar arrangements3–– 114
305 456 1,309
Financing costs:
Items in hedge relationships:
Other loans 228 211 746
Interest rate swaps (184) (178) (338)
Dividends on redeemable preference shares 57 56 58
Fair value hedging instrument (81) (539) (47)
Fair value of hedged item 112 511 40
Cash ow hedges transferred from equity – – 17
Other nancial liabilities held at amortised cost:
Bank loans and overdrafts4720 769 629
Other loans2736 785 121
Interest credit on settlement of tax issues5(92) (9) (826)
Equity put rights and similar arrangements3136 81 19
Finance leases – 1 9
Fair value through the income statement (held for trading):
Derivatives – forward starting swaps and futures 105 244 1
Other251 – –
1,788 1,932 429
Net nancing costs/(investment income) 1,483 1,476 (880)
Notes:
1 Gain on settlement of loans and receivables issued by SoftBank Mobile Corp.
2 Amounts for 2013 include net foreign exchange losses of £91 million (2012: £55 million gain; 2011 £405 million gain) arising from net foreign exchange movements on certain intercompany balances. Amounts for 2012 and
2011 include foreign exchange gains arising on investments held following the disposal of Vodafone Japan to SoftBank Corp.
3 Includes amounts in relation to the Group’s arrangements with its non-controlling interest partners in India.
4 The Group capitalised £8 million of interest expense in the year (2012: £25 million; 2011: £38 million). The interest rate used to determine the amount of borrowing costs eligible for capitalisation was 5.6%.
5 Amounts for 2013, 2012 and 2011 include a reduction of the provision for potential interest on tax issues.
103 Vodafone Group Plc
Annual Report 2013
Overview Business
review Performance Governance Financials Additional
information