Vodafone 2013 Annual Report Download - page 92
Download and view the complete annual report
Please find page 92 of the 2013 Vodafone annual report below. You can navigate through the pages in the report by either clicking on the pages listed below, or by using the keyword search tool below to find specific information within the annual report.-
 1
1 -
2
-
3
-
4
-
5
-
6
-
7
-
8
-
9
-
10
-
11
-
12
-
13
-
14
-
15
-
16
-
17
-
18
-
19
-
20
-
21
-
22
-
23
-
24
-
25
-
26
-
27
-
28
-
29
-
30
-
31
-
32
-
33
-
34
-
35
-
36
-
37
-
38
-
39
-
40
-
41
-
42
-
43
-
44
-
45
-
46
-
47
-
48
-
49
-
50
-
51
-
52
-
53
-
54
-
55
-
56
-
57
-
58
-
59
-
60
-
61
-
62
-
63
-
64
-
65
-
66
-
67
-
68
-
69
-
70
-
71
-
72
-
73
-
74
-
75
-
76
-
77
-
78
-
79
-
80
-
81
-
 82
82 -
 83
83 -
 84
84 -
 85
85 -
 86
86 -
 87
87 -
 88
88 -
 89
89 -
 90
90 -
 91
91 -
 92
92 -
 93
93 -
 94
94 -
 95
95 -
 96
96 -
 97
97 -
 98
98 -
 99
99 -
 100
100 -
 101
101 -
 102
102 -
103
-
104
-
105
-
106
-
107
-
108
-
109
-
110
-
111
-
112
-
113
-
114
-
115
-
116
-
117
-
118
-
119
-
120
-
121
-
122
-
123
-
124
-
125
-
126
-
127
-
128
-
129
-
130
-
131
-
132
-
133
-
134
-
135
-
136
-
137
-
138
-
139
-
140
-
141
-
142
-
143
-
144
-
145
-
146
-
147
-
148
-
149
-
150
-
151
-
152
-
153
-
154
-
155
-
156
-
157
-
158
-
159
-
160
-
161
-
162
-
163
-
164
-
165
-
166
-
167
-
168
-
169
-
170
-
171
-
172
-
173
-
174
-
175
-
176
-
177
-
178
-
179
-
180
-
181
-
182
-
183
-
184
-
185
-
186
-
187
-
188
-
189
-
190
-
191
-
192
 |
 |

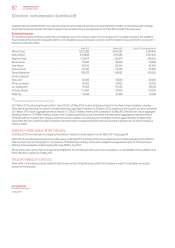
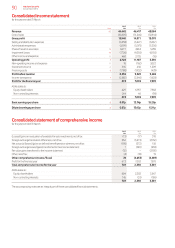
Consolidated income statement
for the years ended 31 March
2013 2012 2011
Note £m £m £m
Revenue A2 44,445 46,417 45,884
Cost of sales (30,505) (31,546) (30,814)
Gross prot 13,940 14,871 15,070
Selling and distribution expenses (3,258) (3,227) (3,067)
Administrative expenses (5,199) (5,075) (5,300)
Share of result in associates 15 6,477 4,963 5,059
Impairment losses 12 (7,700) (4,050) (6,150)
Other income and expense 11 468 3,705 (16)
Operating prot 3 4,728 11,187 5,596
Non-operating income and expense 11 10 (162) 3,022
Investment income 6 305 456 1,309
Financing costs 6 (1,788) (1,932) (429)
Prot before taxation 3,255 9,549 9,498
Income tax expense 7 (2,582) (2,546) (1,628)
Prot for the nancial year 673 7,003 7,870
Attributable to:
– Equity shareholders 429 6,957 7,968
– Non-controlling interests 244 46 (98)
673 7,003 7,870
Basic earnings per share 8 0.87p 13.74p 15.20p
Diluted earnings per share 8 0.87p 13.65p 15.11p
Consolidated statement of comprehensive income
for the years ended 31 March
2013 2012 2011
£m £m £m
(Losses)/gains on revaluation of available-for-sale investments, net of tax (73) (17) 310
Foreign exchange translation differences, net of tax 362 (3,673) (2,132)
Net actuarial (losses)/gains on dened benet pension schemes, net of tax (198) (272) 136
Foreign exchange losses/(gains) transferred to the income statement 1 (681) (630)
Fair value gains transferred to the income statement (12) – (2,192)
Other, net of tax (4) (10) 19
Other comprehensive income/(loss) 76 (4,653) (4,489)
Prot for the nancial year 673 7,003 7,870
Total comprehensive income for the year 749 2,350 3,381
Attributable to:
– Equity shareholders 604 2,383 3,567
– Non-controlling interests 145 (33) (186)
749 2,350 3,381
The accompanying notes are an integral part of these consolidated nancial statements.
90 Vodafone Group Plc
Annual Report 2013