Vodafone 2013 Annual Report Download - page 157
Download and view the complete annual report
Please find page 157 of the 2013 Vodafone annual report below. You can navigate through the pages in the report by either clicking on the pages listed below, or by using the keyword search tool below to find specific information within the annual report.-
 1
1 -
2
-
3
-
4
-
5
-
6
-
7
-
8
-
9
-
10
-
11
-
12
-
13
-
14
-
15
-
16
-
17
-
18
-
19
-
20
-
21
-
22
-
23
-
24
-
25
-
26
-
27
-
28
-
29
-
30
-
31
-
32
-
33
-
34
-
35
-
36
-
37
-
38
-
39
-
40
-
41
-
42
-
43
-
44
-
45
-
46
-
47
-
48
-
49
-
50
-
51
-
52
-
53
-
54
-
55
-
56
-
57
-
58
-
59
-
60
-
61
-
62
-
63
-
64
-
65
-
66
-
67
-
68
-
69
-
70
-
71
-
72
-
73
-
74
-
75
-
76
-
77
-
78
-
79
-
80
-
81
-
82
-
83
-
84
-
85
-
86
-
87
-
88
-
89
-
90
-
91
-
92
-
93
-
94
-
95
-
96
-
97
-
98
-
99
-
100
-
101
-
102
-
103
-
104
-
105
-
106
-
107
-
108
-
109
-
110
-
111
-
112
-
113
-
114
-
115
-
116
-
117
-
118
-
119
-
120
-
121
-
122
-
123
-
124
-
125
-
126
-
127
-
128
-
129
-
130
-
131
-
132
-
133
-
134
-
135
-
136
-
137
-
138
-
139
-
140
-
141
-
142
-
143
-
144
-
145
-
146
-
 147
147 -
 148
148 -
 149
149 -
 150
150 -
 151
151 -
 152
152 -
 153
153 -
 154
154 -
 155
155 -
 156
156 -
 157
157 -
 158
158 -
 159
159 -
 160
160 -
 161
161 -
 162
162 -
 163
163 -
 164
164 -
 165
165 -
 166
166 -
 167
167 -
168
-
169
-
170
-
171
-
172
-
173
-
174
-
175
-
176
-
177
-
178
-
179
-
180
-
181
-
182
-
183
-
184
-
185
-
186
-
187
-
188
-
189
-
190
-
191
-
192
 |
 |

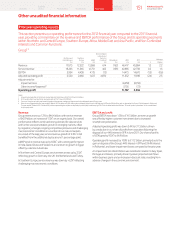
Other AMAP
Organic service revenue, which included Australia, declined by
-1.8%*with both New Zealand and Australia being impacted by MTR
cutseffective from 6 May 2011 and 1 January 2012, respectively.
InAustralia, despite improvements in network and customer operations
performance, service revenue declined by -8.8%* driven by the
competitive market and weakness in brand perception following the
network and customer service issues experienced from late 2010
to early 2011 and further accelerated by MTR cuts. On 22 March
2012, Vodafone Hutchison Australia appointed Bill Morrow as its new
CEO. InEgypt service revenue was suppressed by the challenging
economic and political environment, however, organic growth of 1.4%*
was achieved as a result of an increased customer base and strong
data usage. In Qatar an increase in the customer base delivered service
revenue growth of 27.1%*, despite a competitive pricing environment.
Service revenue in Ghana grew by 29.2%* through strong gains in
customer market share.
EBITDA margin declined -2.2* percentage points, driven by the service
revenue decline in Australia and the challenging economic and
competitive environment in Egypt, partially offset by growth in Qatar
and Ghana.
Safaricom, Vodafone’s associate in Kenya, grew service revenue
by 13.6%*, driven by increases in customer base, voice usage and
M-Pesa activity. EBITDA margin improved in the second half of the 2012
nancial year through a tariff increase in October 2011, operating cost
efciencies and a strengthening of the local currency to take the margin
for the 2012 nancial year to 35.0%.
Non-Controlled Interests
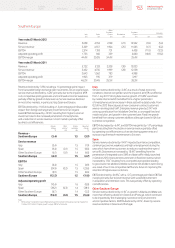
Verizon Wireless1 2 3
2012
£m
2011
£m
% change
£Organic
Service revenue 18,039 17,238 4.6 7.3
Revenue 20,187 18,711 7.9 10.6
EBITDA 7,689 7,313 5.1 7.9
Interest (212) (261) (18.8)
Tax2(287) (235) 22.1
Group’s share of result
in VZW 4,867 4,569 6.5 9.3
In the US VZW reported 4.6 million net mobile customer additions
bringing its closing mobile customer base to 93.0million, up 5.2%.
Service revenue growth of 7.3%* continued to be driven by the
expanding customer base and robust growth in data ARPU driven
byincreased penetration ofsmartphones.
EBITDA margin remained strong despite the competitive challenges
andmacroeconomic environment. Efciencies in operating expenses
and customer acquisition costs resulting from lower volumes were
partly offset by a higher level of customer retention costs reecting the
increased demand for smartphones.
VZW’s net debt at 31 March 2012 totalled US$6.4 billion4 (31March
2011: net debt US$9.8 billion4), after paying a dividend to its
shareholders of US$10 billion on 31 January 2012.
Notes:
1 All amounts represent the Group’s share based on its 45% equity interest, unless otherwise stated.
2 The Group’s share of the tax attributable to VZW relates only to the corporate entities held by the VZW
partnership and certain state taxes which are levied on the partnership. The tax attributable to the
Group’s share of the partnership’s pre-tax prot is included within the Group tax charge.
3 Organic growth rates include the impact of a non-cash revenue adjustment which was recorded to defer
previously recognised data revenue that will be earned and recognised in future periods. Excluding this
the equivalent organic growth rates for service revenue, revenue, EBITDA and the Group’s share of result
in VZW would have been 6.8%*, 10.1%*, 6.7%* and 7.5%* respectively.
4 Net debt excludes pending credit card receipts. Comparatives are presented on a comparable basis.
Liquidity and capital resources
This section includes an analysis of net debt and other disclosures in relation to liquidity and capital resources.
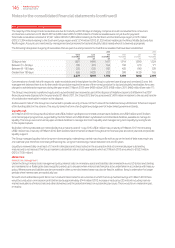
Net debt
Net debt increased by £2.5 billion to £27.0 billion primarily due to the purchase of CWW and TelstraClear, share buybacks, payments to acquire
spectrum, foreign exchange movements and dividend payments to equity holders, partially offset by cash generated by operations, the remaining
consideration from the Group’s disposal of SoftBank Mobile Corp. and the £2.4 billion income dividend from VZW.
Net debt represented 29.5% of our market capitalisation at 31 March 2013 compared to 28.6% at 31 March 2012. Average net debt at month end
accounting dates over the 12 month period ended 31 March 2013 was £24.6 billion and ranged between £22.5 billion and £27.7 billion during the year.
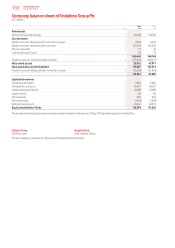
Our consolidated net debt position at 31 March was as follows:
2013 2012
£m £m
Cash and cash equivalents 7, 62 3 7,13 8
Short-term borrowings
Bonds (2,133) (1,289)
Commercial paper1(4,054) (2,272)
Put options over non-controlling interests (938) –
Bank loans (2,929) (1,635)
Other short-term borrowings2(2,235) (1,062)
(12,289) (6,258)
Long-term borrowings
Put options over non-controlling interests (77) (840)
Bonds, loans and other long-term borrowings (29,031) (27,522)
(29,108) (28,362)
Other nancial instruments36,816 3,057
Net debt (26,958) (24,425)
Notes:
1 At 31 March 2013 US$3,484 million was drawn under the US commercial paper programme, and €2,006 million, US$35 million, £10 million and JPY 5 billion were drawn under the euro commercial paper programme.
2 At 31 March 2013 the amount includes £1,151 million (2012: £980 million) in relation to cash received under collateral support agreements.
3 Comprises i) mark-to-market adjustments on derivative nancial instruments which are included as a component of trade and other receivables (2013: £3,032 million; 2012: £2,959 million) and trade and other payables
(2013: £1,104 million; 2012: £889 million) and ii) short-term investments primarily in index linked government bonds and managed investment funds included as a component of other investments (2013: £4,888 million;
2012: £987 million).
155 Vodafone Group Plc
Annual Report 2013
Overview Business
review Performance Governance Financials Additional
information