Vodafone 2013 Annual Report Download - page 182
Download and view the complete annual report
Please find page 182 of the 2013 Vodafone annual report below. You can navigate through the pages in the report by either clicking on the pages listed below, or by using the keyword search tool below to find specific information within the annual report.-
 1
1 -
2
-
3
-
4
-
5
-
6
-
7
-
8
-
9
-
10
-
11
-
12
-
13
-
14
-
15
-
16
-
17
-
18
-
19
-
20
-
21
-
22
-
23
-
24
-
25
-
26
-
27
-
28
-
29
-
30
-
31
-
32
-
33
-
34
-
35
-
36
-
37
-
38
-
39
-
40
-
41
-
42
-
43
-
44
-
45
-
46
-
47
-
48
-
49
-
50
-
51
-
52
-
53
-
54
-
55
-
56
-
57
-
58
-
59
-
60
-
61
-
62
-
63
-
64
-
65
-
66
-
67
-
68
-
69
-
70
-
71
-
72
-
73
-
74
-
75
-
76
-
77
-
78
-
79
-
80
-
81
-
82
-
83
-
84
-
85
-
86
-
87
-
88
-
89
-
90
-
91
-
92
-
93
-
94
-
95
-
96
-
97
-
98
-
99
-
100
-
101
-
102
-
103
-
104
-
105
-
106
-
107
-
108
-
109
-
110
-
111
-
112
-
113
-
114
-
115
-
116
-
117
-
118
-
119
-
120
-
121
-
122
-
123
-
124
-
125
-
126
-
127
-
128
-
129
-
130
-
131
-
132
-
133
-
134
-
135
-
136
-
137
-
138
-
139
-
140
-
141
-
142
-
143
-
144
-
145
-
146
-
147
-
148
-
149
-
150
-
151
-
152
-
153
-
154
-
155
-
156
-
157
-
158
-
159
-
160
-
161
-
162
-
163
-
164
-
165
-
166
-
167
-
168
-
169
-
170
-
171
-
 172
172 -
 173
173 -
 174
174 -
 175
175 -
 176
176 -
 177
177 -
 178
178 -
 179
179 -
 180
180 -
 181
181 -
 182
182 -
 183
183 -
 184
184 -
 185
185 -
 186
186 -
 187
187 -
 188
188 -
 189
189 -
 190
190 -
 191
191 -
 192
192
 |
 |

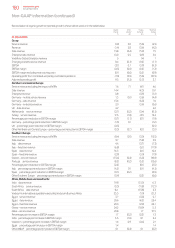
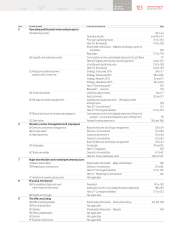
Reconciliation of organic growth to reported growth is shown where used, or in the table below:
Organic
change
%
Other
activity1
pps
Foreign
exchange
pps
Reported
change
%
31 March 2013
Group
Service revenue (1.9) 3.0 (5.6) (4.5)
Revenue (1.4) 2.8 (5.6) (4.2)
Data revenue 13.8 (0.4) (5.9) 7.5
Enterprise data revenue 10.0 0.5 (4.9) 5.6
Vodafone Global Enterprise revenue 5 – (4) 1
Emerging markets service revenue 8.4 (0.3) (9.2) (1.1)
EBITDA (3.1) 0.7 (5.9) (8.3)
EBITDA margin (0.5) (0.6) (0.2) (1.3)
EBITDA margin excluding restructuring costs (0.1) (0.6) (0.2) (0.9)
Operating prot from controlled and jointly controlled operations (7.0) (3.9) (5.6) (16.5)
Adjusted operating prot 9.3 (2.3) (3.3) 3.7
Northern and Central Europe
Service revenue excluding the impact of MTRs 1.6 7.1 (4.1) 4.6
Data revenue 14.4 –(4.3) 10.1
Enterprise revenue 0.8 –(3.9) (3.1)
Germany – mobile service revenue 1.3 (0.1) (5.6) (4.4)
Germany – data revenue 13.6 –(6.0) 7.6
Germany – enterprise revenue 3.0 –(5.6) (2.6)
UK – data revenue 4.2 – – 4.2
Netherlands – service revenue (2.7) (0.2) (5.4) (8.3)
Turkey – service revenue 17.3 (1.8) (3.1) 12.4
Percentage point reduction in EBITDA margin (0.7) (1.1) (0.1) (1.9)
Germany – percentage point reduction in EBITDA margin (1.3) 0.1 –(1.2)
UK – percentage point reduction in EBITDA margin (0.5) – – (0.5)
Other Northern and Central Europe – percentage point reduction in EBITDA margin (0.3) (2.7) (0.1) (3.1)
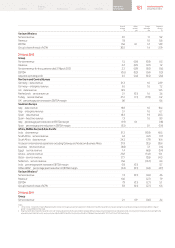
Southern Europe
Service revenue excluding the impact of MTRs (8.4) (0.1) (5.0) (13.5)
Data revenue 9.7 –(5.8) 3.9
Italy – data revenue 4.4 –(5.7) (1.3)
Italy – xed line revenue (6.8) –(5.1) (11.9)
Spain – data revenue 16.5 –(6.1) 10.4
Spain – xed line revenue (2.9) –(5.0) (7.9)
Greece – service revenue (13.4) (0.4) (5.0) (18.8)
Portugal – service revenue (8.2) (0.2) (5.2) (13.6)
Percentage point reduction in EBITDA margin (2.2) –(0.1) (2.3)
Italy – percentage point reduction in EBITDA margin (4.3) 0.1 (0.1) (4.3)
Spain – percentage point reduction in EBITDA margin (0.7) (0.2) –(0.9)
Other Southern Europe – percentage point reduction in EBITDA margin (0.4) –(0.2) (0.6)
Africa, Middle East and Asia Pacic
India – data revenue 19.8 –(13.5) 6.3
South Africa – service revenue (0.3) –(11.8) (12.1)
South Africa – data revenue 16.1 –(13.8) 2.3
Vodacom’s international operations excluding Vodacom Business Africa 23.3 –(1.0) 22.3
Egypt – service revenue 3.7 –(3.0) 0.7
Egypt – data revenue 29.6 –(4.2) 25.4
Egypt – xed line revenue 29.0 –(2.9) 26.1
Ghana – service revenue 24.2 –(18.9) 5.3
Qatar – service revenue 29.8 –1.7 31.5
Percentage point increase in EBITDA margin 1.7 (0.2) (0.2) 1.3
India – percentage point increase in EBITDA margin 3.3 (1.0) 0.1 2.4
Vodacom – percentage point increase in EBITDA margin 1.6 0.9 (0.4) 2.1
Egypt – percentage point increase in EBITDA margin 1.4 – – 1.4
Other AMAP – percentage point increase in EBITDA margin 0.1 (0.4) 0.1 (0.2)
Non-GAAP information (continued)
180 Vodafone Group Plc
Annual Report 2013