Vodafone 2013 Annual Report Download - page 146
Download and view the complete annual report
Please find page 146 of the 2013 Vodafone annual report below. You can navigate through the pages in the report by either clicking on the pages listed below, or by using the keyword search tool below to find specific information within the annual report.-
 1
1 -
2
-
3
-
4
-
5
-
6
-
7
-
8
-
9
-
10
-
11
-
12
-
13
-
14
-
15
-
16
-
17
-
18
-
19
-
20
-
21
-
22
-
23
-
24
-
25
-
26
-
27
-
28
-
29
-
30
-
31
-
32
-
33
-
34
-
35
-
36
-
37
-
38
-
39
-
40
-
41
-
42
-
43
-
44
-
45
-
46
-
47
-
48
-
49
-
50
-
51
-
52
-
53
-
54
-
55
-
56
-
57
-
58
-
59
-
60
-
61
-
62
-
63
-
64
-
65
-
66
-
67
-
68
-
69
-
70
-
71
-
72
-
73
-
74
-
75
-
76
-
77
-
78
-
79
-
80
-
81
-
82
-
83
-
84
-
85
-
86
-
87
-
88
-
89
-
90
-
91
-
92
-
93
-
94
-
95
-
96
-
97
-
98
-
99
-
100
-
101
-
102
-
103
-
104
-
105
-
106
-
107
-
108
-
109
-
110
-
111
-
112
-
113
-
114
-
115
-
116
-
117
-
118
-
119
-
120
-
121
-
122
-
123
-
124
-
125
-
126
-
127
-
128
-
129
-
130
-
131
-
132
-
133
-
134
-
135
-
 136
136 -
 137
137 -
 138
138 -
 139
139 -
 140
140 -
 141
141 -
 142
142 -
 143
143 -
 144
144 -
 145
145 -
 146
146 -
 147
147 -
 148
148 -
 149
149 -
 150
150 -
 151
151 -
 152
152 -
 153
153 -
 154
154 -
 155
155 -
 156
156 -
157
-
158
-
159
-
160
-
161
-
162
-
163
-
164
-
165
-
166
-
167
-
168
-
169
-
170
-
171
-
172
-
173
-
174
-
175
-
176
-
177
-
178
-
179
-
180
-
181
-
182
-
183
-
184
-
185
-
186
-
187
-
188
-
189
-
190
-
191
-
192
 |
 |

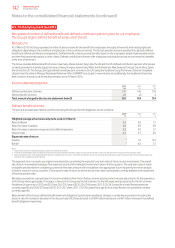
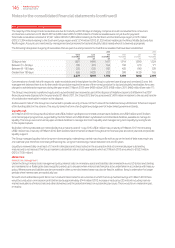
A5. Post employment benets (continued)
Actual return on pension assets
2013 2012 2011
£m £m £m
Actual return on pension assets 335 69 97
Analysis of pension assets at 31 March is as follows: % % %
Equities 43.0 60.1 61.6
Bonds 33.8 37.1 36.5
Property 1.0 0.3 0.3
Annuity policies 13.9 – –
Other 8.3 2.5 1.6
100.0 100.0 100.0
The schemes have no direct investments in the Group’s equity securities or in property currently used by the Group.
History of experience adjustments
2013 2012 2011 2010 2009
£m £m £m £m £m
Experience adjustments on pension liabilities:
Amount (7) (21) 23 8 6
Percentage of pension liabilities –(1%) 1% – –
Experience adjustments on pension assets:
Amount 189 (30) (6) 286 (381)
Percentage of pension assets 5% (2%) – 19% (35%)
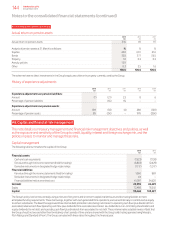
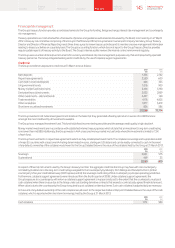
A6. Capital and nancial risk management
This note details our treasury management and nancial risk management objectives and policies, as well
as theexposure and sensitivity of the Group to credit, liquidity, interest and foreign exchange risk, and the
policies in place to monitor and manage these risks.
Capital management
The following table summarises the capital of the Group:
2013 2012
£m £m
Financial assets:
Cash and cash equivalents (7,623) (7,138)
Fair value through the income statement (held for trading) (6,803) (2,629)
Derivative instruments in designated hedge relationships (1,117) (1,317)
Financial liabilities:
Fair value through the income statements (held for trading) 1,060 889
Derivative instruments in designated hedge relationships 44 –
Financial liabilities held at amortised cost 41,397 34,620
Net debt 26,958 24,425
Equity 72,488 78,202
Capital 99,446 102,627
The Group’s policy is to borrow centrally using a mixture of long-term and short-term capital market issues and borrowing facilities to meet
anticipated funding requirements. These borrowings, together with cash generated from operations, are loaned internally or contributed as equity
to certain subsidiaries. The Board has approved three internal debt protection ratios being: net interest to operating cash ow (plus dividends from
associates); retained cash ow (operating cash ow plus dividends from associates less interest, tax, dividends to non-controlling shareholders and
equity dividends) to net debt; and operating cash ow (plus dividends from associates) to net debt. These internal ratios establish levels of debt that
the Group should not exceed other than for relatively short periods of time and are shared with the Group’s debt rating agencies being Moody’s,
FitchRatings and Standard & Poor’s. The Group complied with these ratios throughout the nancial year.
Notes to the consolidated nancial statements (continued)
144 Vodafone Group Plc
Annual Report 2013