Vodafone 2013 Annual Report Download - page 153
Download and view the complete annual report
Please find page 153 of the 2013 Vodafone annual report below. You can navigate through the pages in the report by either clicking on the pages listed below, or by using the keyword search tool below to find specific information within the annual report.-
 1
1 -
2
-
3
-
4
-
5
-
6
-
7
-
8
-
9
-
10
-
11
-
12
-
13
-
14
-
15
-
16
-
17
-
18
-
19
-
20
-
21
-
22
-
23
-
24
-
25
-
26
-
27
-
28
-
29
-
30
-
31
-
32
-
33
-
34
-
35
-
36
-
37
-
38
-
39
-
40
-
41
-
42
-
43
-
44
-
45
-
46
-
47
-
48
-
49
-
50
-
51
-
52
-
53
-
54
-
55
-
56
-
57
-
58
-
59
-
60
-
61
-
62
-
63
-
64
-
65
-
66
-
67
-
68
-
69
-
70
-
71
-
72
-
73
-
74
-
75
-
76
-
77
-
78
-
79
-
80
-
81
-
82
-
83
-
84
-
85
-
86
-
87
-
88
-
89
-
90
-
91
-
92
-
93
-
94
-
95
-
96
-
97
-
98
-
99
-
100
-
101
-
102
-
103
-
104
-
105
-
106
-
107
-
108
-
109
-
110
-
111
-
112
-
113
-
114
-
115
-
116
-
117
-
118
-
119
-
120
-
121
-
122
-
123
-
124
-
125
-
126
-
127
-
128
-
129
-
130
-
131
-
132
-
133
-
134
-
135
-
136
-
137
-
138
-
139
-
140
-
141
-
142
-
 143
143 -
 144
144 -
 145
145 -
 146
146 -
 147
147 -
 148
148 -
 149
149 -
 150
150 -
 151
151 -
 152
152 -
 153
153 -
 154
154 -
 155
155 -
 156
156 -
 157
157 -
 158
158 -
 159
159 -
 160
160 -
 161
161 -
 162
162 -
 163
163 -
164
-
165
-
166
-
167
-
168
-
169
-
170
-
171
-
172
-
173
-
174
-
175
-
176
-
177
-
178
-
179
-
180
-
181
-
182
-
183
-
184
-
185
-
186
-
187
-
188
-
189
-
190
-
191
-
192
 |
 |

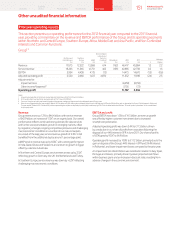
Other unaudited nancial information
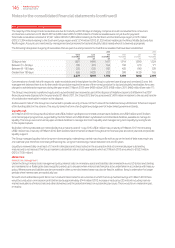
Prior year operating results
This section presents our operating performance for the 2012 nancial year compared to the 2011 nancial
year, providing commentary on the revenue and EBITDA performance of the Group and its operating segments
within Northern and Central Europe, Southern Europe, Africa, Middle East and Asia Pacic, and Non-Controlled
Interests and Common Functions.
Group1 2
Northern and
Central Europe
£m
Southern
Europe
£m
AMAP
£m
Non-Controlled
Interests and
Common
Functions3
£m
Eliminations
£m
2012
£m
2011
£m
% change
£Organic
Revenue 19,575 12,522 13,868 614 (162) 46,417 45,884 1.2 2.2
Service revenue 18,265 11,565 12,751 463 (159) 42,885 42,738 0.3 1.5
EBITDA 5,934 4,438 4 ,115 (12) –14,475 14,670 (1.3) (0.6)
Adjusted operating prot 2,530 2,660 1,472 4,870 –11, 5 32 11, 8 18 (2.4) 2.5
Adjustments for:
Impairment loss (4,050) (6,150)
Other income/(expense)43,705 (72)
Operating prot 11,187 5,596
Notes:
1 Amounts are presented on the Group’s revised segment basis (see note A2 for further information).
2 2012 results reect average foreign exchange rates of £1:€1.16 and £1:US$1.60.
3 Common Functions primarily represent the results of the partner markets and the net result of unallocated central Group costs.
4 Other income/(expense) for the year ended 31 March 2012 includes a £3,419 million gain on disposal of the Group’s 44% interest in SFR and a £296 million gain on disposal of the Group’s 24.4% interest in Polkomtel.
Theyearended 31 March 2011 included £56 million representing the net loss on disposal of certain Alltel investments by VZW. This is included within the line item “Share of results in associates” in the consolidated
income statement.
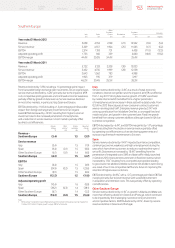
Revenue
Group revenue was up 1.2% to £46.4 billion, with service revenue
of £42.9 billion, an increase of 1.5%* on an organic basis. Our overall
performance reects continued strong demand for data services
and further voice penetration growth in emerging markets, offset
by regulatory changes, ongoing competitive pressures and challenging
macroeconomic conditions in a number of our mature markets.
As a result of the leap year, service revenue growth of 2.3%* in Q4
beneted from the additional day by around 1 percentage point.
AMAP service revenue was up by 8.0%*, with a strong performance
in India, Qatar, Ghana and Vodacom and a return to growth in Egypt
offset by a decline in Australia.
In Northern and Central Europe, service revenue was up by 2.5%*
reecting growth in Germany, the UK, the Netherlands and Turkey.
In Southern Europe, service revenue was down by -6.2%* reecting
challenging macroeconomic conditions.
EBITDA and prot
Group EBITDA was down 1.3% to £14.5 billion, as revenue growth
was offset by higher customer investment due to increased
smartphone penetration.
Adjusted operating prot was down 2.4% to £11.5 billion, driven
by a reduction in our share of prots from associates following the
disposal ofour 44% interest in SFR in June 2011. Our share of prots
of VZW grew by 9.3%* to £4.9 billion.
Operating prot increased by 100% to £11.2 billion, primarily due to the
gain on disposal of the Group’s 44% interest in SFR and 24.4% interest
in Polkomtel, and lower impairment losses compared to the prior year.
An impairment loss of £4.0 billion was recorded in relation to Italy, Spain,
Portugal and Greece, primarily driven by lower projected cash ows
within business plans and an increase in discount rates, resulting from
adverse changes in the economic environment.
151 Vodafone Group Plc
Annual Report 2013
Overview Business
review Performance Governance Financials Additional
information