Vodafone 2013 Annual Report Download - page 89
Download and view the complete annual report
Please find page 89 of the 2013 Vodafone annual report below. You can navigate through the pages in the report by either clicking on the pages listed below, or by using the keyword search tool below to find specific information within the annual report.-
 1
1 -
2
-
3
-
4
-
5
-
6
-
7
-
8
-
9
-
10
-
11
-
12
-
13
-
14
-
15
-
16
-
17
-
18
-
19
-
20
-
21
-
22
-
23
-
24
-
25
-
26
-
27
-
28
-
29
-
30
-
31
-
32
-
33
-
34
-
35
-
36
-
37
-
38
-
39
-
40
-
41
-
42
-
43
-
44
-
45
-
46
-
47
-
48
-
49
-
50
-
51
-
52
-
53
-
54
-
55
-
56
-
57
-
58
-
59
-
60
-
61
-
62
-
63
-
64
-
65
-
66
-
67
-
68
-
69
-
70
-
71
-
72
-
73
-
74
-
75
-
76
-
77
-
78
-
 79
79 -
 80
80 -
 81
81 -
 82
82 -
 83
83 -
 84
84 -
 85
85 -
 86
86 -
 87
87 -
 88
88 -
 89
89 -
 90
90 -
 91
91 -
 92
92 -
 93
93 -
 94
94 -
 95
95 -
 96
96 -
 97
97 -
 98
98 -
 99
99 -
100
-
101
-
102
-
103
-
104
-
105
-
106
-
107
-
108
-
109
-
110
-
111
-
112
-
113
-
114
-
115
-
116
-
117
-
118
-
119
-
120
-
121
-
122
-
123
-
124
-
125
-
126
-
127
-
128
-
129
-
130
-
131
-
132
-
133
-
134
-
135
-
136
-
137
-
138
-
139
-
140
-
141
-
142
-
143
-
144
-
145
-
146
-
147
-
148
-
149
-
150
-
151
-
152
-
153
-
154
-
155
-
156
-
157
-
158
-
159
-
160
-
161
-
162
-
163
-
164
-
165
-
166
-
167
-
168
-
169
-
170
-
171
-
172
-
173
-
174
-
175
-
176
-
177
-
178
-
179
-
180
-
181
-
182
-
183
-
184
-
185
-
186
-
187
-
188
-
189
-
190
-
191
-
192
 |
 |

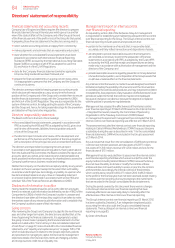
The relative size of the Group’s intangible assets, excluding goodwill,
makes the judgements surrounding the estimated useful lives critical
tothe Group’s nancial position and performance.
At 31 March 2013 intangible assets, excluding goodwill, amounted
to £22,025 million (2012: £21,164 million) and represented 15.4%
(2012:15.2%) of the Group’s total assets.
Estimation of useful life
The useful life used to amortise intangible assets relates
to the expectedfuture performance of the assets acquired and
management’s estimate of the period over which economic benet will
be derived from the asset. The basis for determining the useful life for
the most signicant categories of intangible assets is as follows:
Licences and spectrum fees
The estimated useful life is generally the term of the licence unless
there is a presumption of renewal at negligible cost. Using the licence
term reects the period over which the Group will receive economic
benet. For technology-specic licences with a presumption of renewal
at negligible cost, the estimated useful economic life reects the
Group’s expectation of the period over which the Group will continue
to receive economic benet from the licence. The economic lives are
periodically reviewed taking into consideration such factors as changes
in technology. Historically any changes to economic lives have not been
material following these reviews.
Customer bases
The estimated useful life principally reects management’s view
of theaverage economic life of the customer base and is assessed
by reference to customer churn rates. An increase in churn rates may
leadto a reduction in the estimated useful life and an increase in the
amortisation charge. Historically changes to the estimated useful
liveshave not had a signicant impact on the Group’s results and
nancialposition.
Capitalised software
The useful life is determined by management at the time the
softwareisacquired and brought into use and is regularly reviewed
forappropriateness. For computer software licences, the useful life
represents management’s view of the expected term over which the
Group will receive benets from the software, but not exceeding the
licence term. For unique software products controlled by the Group,
the lifeisbased on historical experience with similar products as well
asanticipation of future events which may impact their life such
as changes in technology. Historically changes in useful lives have not
resulted in material changes to the Group’s amortisation charge.
Property, plant and equipment
Property, plant and equipment also represent a signicant proportion
ofthe asset base of the Group being 14.2% (2012: 13.4%) of the
Group’stotal assets. Therefore the estimates and assumptions made
todetermine their carrying value and related depreciation are critical
tothe Group’s nancial position and performance.
Estimation of useful life
The charge in respect of periodic depreciation is derived after
determining an estimate of an asset’s expected useful life and
the expected residual value at the end of its life. Increasing
an asset’s expected life or its residual value would result in a reduced
depreciation charge in the consolidated income statement.
The useful lives and residual values of the Group’s assets are determined
by management at the time the asset is acquired and reviewed annually
forappropriateness. The lives are based on historical experience
withsimilar assets as well as anticipation of future events which may
impacttheir life such as changes in technology. Furthermore, network
infrastructure is only depreciated over a period that extends beyond
theexpiry of the associated licence under which the operator provides
telecommunications services if there is a reasonable expectation
of renewal or an alternative future use for the asset.
Historically changes in useful lives and residual values have not resulted
in material changes to the Group’s depreciation charge.
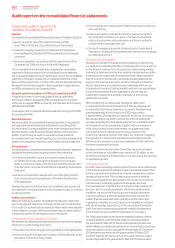
Provisions and contingent liabilities
The Group exercises judgement in measuring and recognising
provisions and the exposures to contingent liabilities related to pending
litigation or other outstanding claims subject to negotiated settlement,
mediation, arbitration or government regulation, as well as other
contingent liabilities (see note 21 to the consolidated nancial
statements). Judgement is necessary in assessing the likelihood that
a pending claim will succeed, or a liability will arise, and to quantify the
possible range of the nancial settlement. Because of the inherent
uncertainty in this evaluation process, actual losses may be different
from the originally estimated provision.
Impairment reviews
IFRS requires management to undertake an annual test for impairment
of indenite lived assets and, for nite lived assets, to test for impairment
if events or changes in circumstances indicate that the carrying amount
of an asset may not be recoverable.
Impairment testing is an area involving management judgement,
requiring assessment as to whether the carrying value of assets can
be supported by the net present value of future cash ows derived from
such assets using cash ow projections which have been discounted
atan appropriate rate. In calculating the net present value of the future
cash ows, certain assumptions are required to be made in respect
of highly uncertain matters including management’s expectations of:
a growth in EBITDA, calculated as adjusted operating prot before
depreciation and amortisation;
a timing and quantum of future capital expenditure;
a long-term growth rates; and
a the selection of discount rates to reect the risks involved.
The Group prepares and approves formal ve year management
plansfor its operations, which are used in the value in use calculations.
In certain developing markets the fth year of the management
planmay not be indicative of the long-term future performance
as operations may not have reached maturity. For these operations,
theGroup extends the plan data for an additional ve year period.
For businesses where the ve year management plans are used for
theGroup’s value in use calculations, a long-term growth rate into
perpetuity has been determined as the lower of:
a the nominal GDP growth rates for the country of operation; and
a the long-term compound annual growth rate in EBITDA in years six
to ten estimated by management.
For businesses where the plan data is extended for an additional ve
years for the Group’s value in use calculations, a long-term growth rate
into perpetuity has been determined as the lower of:
a the nominal GDP growth rates for the country of operation; and
a the compound annual growth rate in EBITDA in years nine to ten
of the management plan.
Changing the assumptions selected by management, in particular
thediscount rate and growth rate assumptions used in the cash ow
projections, could signicantly affect the Group’s impairment evaluation
and hence results.
The Group’s review includes the key assumptions related to sensitivity
in the cash ow projections. Further details are provided in note 12
to the consolidated nancial statements.
87 Vodafone Group Plc
Annual Report 2013
Overview Business
review Performance Governance Financials Additional
information