Vodafone 2013 Annual Report Download - page 97
Download and view the complete annual report
Please find page 97 of the 2013 Vodafone annual report below. You can navigate through the pages in the report by either clicking on the pages listed below, or by using the keyword search tool below to find specific information within the annual report.-
 1
1 -
2
-
3
-
4
-
5
-
6
-
7
-
8
-
9
-
10
-
11
-
12
-
13
-
14
-
15
-
16
-
17
-
18
-
19
-
20
-
21
-
22
-
23
-
24
-
25
-
26
-
27
-
28
-
29
-
30
-
31
-
32
-
33
-
34
-
35
-
36
-
37
-
38
-
39
-
40
-
41
-
42
-
43
-
44
-
45
-
46
-
47
-
48
-
49
-
50
-
51
-
52
-
53
-
54
-
55
-
56
-
57
-
58
-
59
-
60
-
61
-
62
-
63
-
64
-
65
-
66
-
67
-
68
-
69
-
70
-
71
-
72
-
73
-
74
-
75
-
76
-
77
-
78
-
79
-
80
-
81
-
82
-
83
-
84
-
85
-
86
-
 87
87 -
 88
88 -
 89
89 -
 90
90 -
 91
91 -
 92
92 -
 93
93 -
 94
94 -
 95
95 -
 96
96 -
 97
97 -
 98
98 -
 99
99 -
 100
100 -
 101
101 -
 102
102 -
 103
103 -
 104
104 -
 105
105 -
 106
106 -
 107
107 -
108
-
109
-
110
-
111
-
112
-
113
-
114
-
115
-
116
-
117
-
118
-
119
-
120
-
121
-
122
-
123
-
124
-
125
-
126
-
127
-
128
-
129
-
130
-
131
-
132
-
133
-
134
-
135
-
136
-
137
-
138
-
139
-
140
-
141
-
142
-
143
-
144
-
145
-
146
-
147
-
148
-
149
-
150
-
151
-
152
-
153
-
154
-
155
-
156
-
157
-
158
-
159
-
160
-
161
-
162
-
163
-
164
-
165
-
166
-
167
-
168
-
169
-
170
-
171
-
172
-
173
-
174
-
175
-
176
-
177
-
178
-
179
-
180
-
181
-
182
-
183
-
184
-
185
-
186
-
187
-
188
-
189
-
190
-
191
-
192
 |
 |

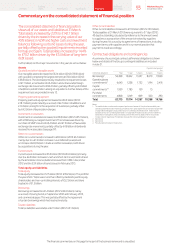
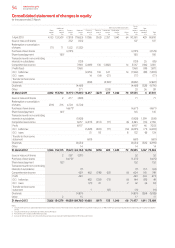
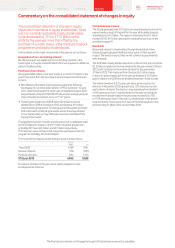
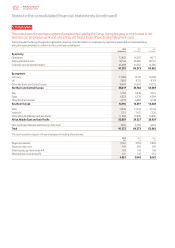
Commentary on the consolidated statement of changes in equity
The consolidated statement of changes in equity
shows the movements in equity shareholders’ funds
and non-controlling interests. Equity shareholders
funds decreased by -7.1% to £71.5 billion as the
prot for the year was more than offset by the
purchase of our own shares under the share buyback
programmes and equity dividends paid.
Further details on the major movements in the year are set out below:
Acquisition of non-controlling interest
We did not acquire any signicant non-controlling interests in the
current year. In the year ended 31 March 2012 we acquired an additional
stake in Vodafone India.
Purchase of own shares
We acquired 894 million of our own shares at a cost of £1.5 billion in the
year. These arose from the two share buyback programmes that were
in place.
a We initiated a £4.0 billion share buyback programme following
the disposal of our entire 44% interest in SFR to Vivendi on 16 June
2011. Under this programme, which was completed in August 2012,
we purchased a total of 2,330,039,575 shares at an average price per
share, including transaction costs, of 171.67 pence.
a Following the receipt of a US$3.8 billion (£2.4 billion) income
dividend from VZW in December 2012, we initiated a £1.5 billion
share buyback programme. The Group placed irrevocable purchase
instructions with a third party to enable shares to be repurchased
on our behalf when we may otherwise have been prohibited from
buying in the market.
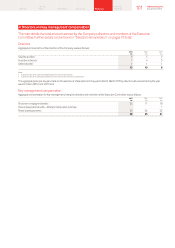
The aggregate number of shares and the amount of consideration paid
by the Company in relation to the £1.5 billion buyback programme
at 20 May 2013 was 406 million and £0.7 billion respectively.
The maximum value of shares that may yet be purchased under the
programme at 20 May 2013 is £0.8 billion.
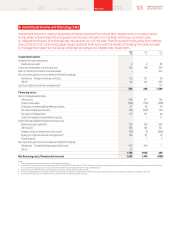
The movement in treasury shares during the year is shown below:
Number
Million £m
1 April 2012 4,169 7,841
Reissue of shares (161) (287)
Purchase of shares 894 1,475
31 March 2013 4,902 9,029
The reissue of shares in the year was to satisfy obligations under
employee share schemes.
Comprehensive income
The Group generated over £0.7 billion of comprehensive income in the
year, primarily a result of the prot for the year attributable to equity
shareholders of £0.4 billion. The reasons underlying the £0.1 billion
increase (2012: £4.7 billion decrease) in comprehensive income are
provided on page 91.
Dividends
We provide returns to shareholders through dividends and have
historically generally paid dividends twice a year in February and
August. The directors expect that we will continue to pay dividends
semi-annually.
The £4.8 billion equity dividend reduction in the current year comprises
£3.2 billion in relation to the nal dividend for the year ended 31 March
2012 and £1.6 billion for the interim dividend for the year ended
31 March 2013. This is reduced from the total £6.7 billion charge
in theprior year primarily due to the special dividend of £2.0 billion
paidin relation to a VZW income dividend received in the prior year.
The interim dividend of 3.27 pence per share announced by the
directors in November 2012 represented a 7.2% increase over last
year’s interim dividend. The directors are proposing a nal dividend
of 6.92 pence per share. Total dividends for the year, excluding the
second interim dividend paid in the prior year, increased by 7.0%
to 10.19pence per share, in line with our dividend per share growth
target of at least 7% per annum for each of the nancial years in the
period ending 31 March 2013, issued in May 2010.
The nancial commentary on this page forms part of the business review and is unaudited.
95 Vodafone Group Plc
Annual Report 2013
Overview Business
review Performance Governance Financials Additional
information