Vodafone 2013 Annual Report Download - page 128
Download and view the complete annual report
Please find page 128 of the 2013 Vodafone annual report below. You can navigate through the pages in the report by either clicking on the pages listed below, or by using the keyword search tool below to find specific information within the annual report.-
 1
1 -
2
-
3
-
4
-
5
-
6
-
7
-
8
-
9
-
10
-
11
-
12
-
13
-
14
-
15
-
16
-
17
-
18
-
19
-
20
-
21
-
22
-
23
-
24
-
25
-
26
-
27
-
28
-
29
-
30
-
31
-
32
-
33
-
34
-
35
-
36
-
37
-
38
-
39
-
40
-
41
-
42
-
43
-
44
-
45
-
46
-
47
-
48
-
49
-
50
-
51
-
52
-
53
-
54
-
55
-
56
-
57
-
58
-
59
-
60
-
61
-
62
-
63
-
64
-
65
-
66
-
67
-
68
-
69
-
70
-
71
-
72
-
73
-
74
-
75
-
76
-
77
-
78
-
79
-
80
-
81
-
82
-
83
-
84
-
85
-
86
-
87
-
88
-
89
-
90
-
91
-
92
-
93
-
94
-
95
-
96
-
97
-
98
-
99
-
100
-
101
-
102
-
103
-
104
-
105
-
106
-
107
-
108
-
109
-
110
-
111
-
112
-
113
-
114
-
115
-
116
-
117
-
 118
118 -
 119
119 -
 120
120 -
 121
121 -
 122
122 -
 123
123 -
 124
124 -
 125
125 -
 126
126 -
 127
127 -
 128
128 -
 129
129 -
 130
130 -
 131
131 -
 132
132 -
 133
133 -
 134
134 -
 135
135 -
 136
136 -
 137
137 -
 138
138 -
139
-
140
-
141
-
142
-
143
-
144
-
145
-
146
-
147
-
148
-
149
-
150
-
151
-
152
-
153
-
154
-
155
-
156
-
157
-
158
-
159
-
160
-
161
-
162
-
163
-
164
-
165
-
166
-
167
-
168
-
169
-
170
-
171
-
172
-
173
-
174
-
175
-
176
-
177
-
178
-
179
-
180
-
181
-
182
-
183
-
184
-
185
-
186
-
187
-
188
-
189
-
190
-
191
-
192
 |
 |

24. Borrowings (continued)
Maturity of borrowings
The maturity prole of the anticipated future cash ows including interest in relation to the Group’s non-derivative nancial liabilities
on an undiscounted basis which, therefore, differs from both the carrying value and fair value, is as follows:
Redeemable Loans in fair
Bank preference Commercial Other value hedge
loans shares paper Bonds liabilities relationships Total
£m £m £m £m £m £m £m
Within one year 3,390 56 4,070 2,946 2,263 277 13,002
In one to two years 590 56 – 3,313 138 870 4,967
In two to three years 484 56 – 4,753 1,101 266 6,660
In three to four years 1,534 56 – 1,636 599 245 4,070
In four to ve years 1,080 56 – 3 ,156 72 245 4,609
In more than ve years 1,946 1, 212 – 5,877 52 7, 913 17,000
9,024 1,492 4,070 21,681 4,225 9,816 50,308
Effect of discount/nancing rates (1,814) (137) (16) (3,850) (299) (2,795) (8,911)
31 March 2013 7,210 1,355 4,054 17,831 3,926 7,021 41,397
Within one year 684 56 2,283 2,000 1,044 199 6,266
In one to two years 2,983 56 – 2,828 771 199 6,837
In two to three years 567 56 – 3,197 – 762 4,582
In three to four years 1,316 56 – 3,536 1,235 191 6,334
In four to ve years 1,574 56 – 1,541 726 169 4,066
In more than ve years 1,466 1,214 – 6,780 69 4,465 13,994
8,590 1,494 2,283 19,882 3,845 5,985 42,079
Effect of discount/nancing rates (1,331) (213) (11) (4,130) (366) (1,408) (7,459)
31 March 2012 7,259 1,281 2,272 15,752 3,479 4,577 34,620
The maturity prole of the Group’s nancial derivatives (which include interest rate and foreign exchange swaps), using undiscounted cash ows,
is as follows:
2013 2012
Payable Receivable Payable Receivable
£m £m £m £m
Within one year 10,671 11, 0 20 14,357 14,498
In one to two years 1,014 1, 214 675 786
In two to three years 1,308 1,495 561 678
In three to four years 2,803 3,087 540 641
In four to ve years 581 780 402 520
In more than ve years 3,579 4,454 2,533 3,566
19,956 22,050 19,068 20,689
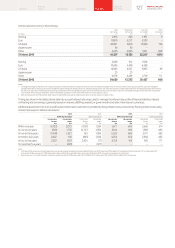
The currency split of the Group’s foreign exchange derivatives is as follows:
2013 2012
Payable Receivable Payable Receivable
£m £m £m £m
Sterling 2,365 4,477 1,287 7,070
Euro 6,583 602 4,793 2,613
US dollar 348 6,130 4,415 2,445
Japanese yen 669 1,296 2,207 23
Other 3,945 1,768 962 1,552
13,910 14,273 13,664 13,703
Payables and receivables are stated separately in the table above as settlement is on a gross basis. The £363 million net receivable (2012: £39 million
net receivable) in relation to foreign exchange nancial instruments in the table above is split £44 million (2012: £89 million) within trade and other
payables and £407 million (2012: £128 million) within trade and other receivables.
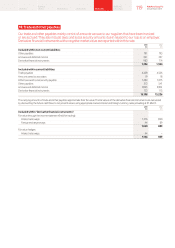
The present value of minimum lease payments under nance lease arrangements under which the Group has leased certain of its equipment
is analysed as follows:
2013 2012
£m £m
Within one year 37 18
In two to ve years 42 34
In more than ve years 53 34
Notes to the consolidated nancial statements (continued)
126 Vodafone Group Plc
Annual Report 2013