Virgin Media 2013 Annual Report Download - page 91
Download and view the complete annual report
Please find page 91 of the 2013 Virgin Media annual report below. You can navigate through the pages in the report by either clicking on the pages listed below, or by using the keyword search tool below to find specific information within the annual report.-
 1
1 -
2
-
3
-
4
-
5
-
6
-
7
-
8
-
9
-
10
-
11
-
12
-
13
-
14
-
15
-
16
-
17
-
18
-
19
-
20
-
21
-
22
-
23
-
24
-
25
-
26
-
27
-
28
-
29
-
30
-
31
-
32
-
33
-
34
-
35
-
36
-
37
-
38
-
39
-
40
-
41
-
42
-
43
-
44
-
45
-
46
-
47
-
48
-
49
-
50
-
51
-
52
-
53
-
54
-
55
-
56
-
57
-
58
-
59
-
60
-
61
-
62
-
63
-
64
-
65
-
66
-
67
-
68
-
69
-
70
-
71
-
72
-
73
-
74
-
75
-
76
-
77
-
78
-
79
-
80
-
 81
81 -
 82
82 -
 83
83 -
 84
84 -
 85
85 -
 86
86 -
 87
87 -
 88
88 -
 89
89 -
 90
90 -
 91
91 -
 92
92 -
 93
93 -
 94
94 -
 95
95 -
 96
96 -
 97
97 -
 98
98 -
 99
99 -
 100
100 -
 101
101 -
102
-
103
-
104
-
105
-
106
-
107
-
108
-
109
-
110
-
111
-
112
-
113
-
114
-
115
-
116
-
117
-
118
-
119
-
120
-
121
-
122
-
123
-
124
-
125
-
126
-
127
-
128
-
129
-
130
-
131
-
132
-
133
-
134
-
135
-
136
-
137
-
138
-
139
 |
 |

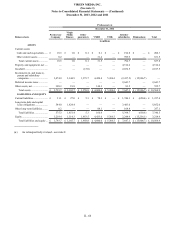
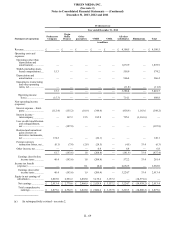
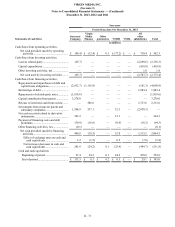
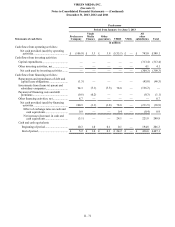
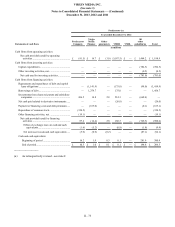
VIRGIN MEDIA INC.
(See note 1)
Notes to Consolidated Financial Statements — (Continued)
December 31, 2013, 2012 and 2011
II - 66
Predecessor (a)
December 31, 2012
Balance sheets Predecessor
Company
Virgin
Media
Finance Other
guarantors VMIH VMIL All other
subsidiaries Eliminations Total
in millions
ASSETS
Current assets:
Cash and cash equivalents...... £ 10.3 £ 1.0 £ 0.1 £ 0.1 £ — £ 194.8 £ — £ 206.3
Other current assets ................ 0.2 — — 31.4 — 599.9 — 631.5
Total current assets .............. 10.5 1.0 0.1 31.5 — 794.7 — 837.8
Property and equipment, net ..... — — — — — 4,512.2 — 4,512.2
Goodwill ................................... — — (15.0) — — 2,032.5 — 2,017.5
Investments in, and loans to,
parent and subsidiary
companies.............................. 3,474.9 3,144.9 1,973.7 4,424.4 5,306.3 (2,417.5) (15,906.7) —
Deferred income taxes .............. — — — — — 2,641.7 — 2,641.7
Other assets, net ........................ 308.3 19.8 — 144.1 — 83.5 — 555.7
Total assets........................... £ 3,793.7 £ 3,165.7 £ 1,958.8 £ 4,600.0 £ 5,306.3 £ 7,647.1 £ (15,906.7) £ 10,564.9
LIABILITIES AND EQUITY
Current liabilities....................... £ 31.1 £ 27.0 £ 5.3 £ 78.3 £ — £ 1,746.3 £ (650.6) £ 1,237.4
Long-term debt and capital
lease obligations.................... 544.0 1,824.4 — — — 3,483.6 — 5,852.0
Other long-term liabilities......... 0.2 — — 88.1 — 168.8 — 257.1
Total liabilities..................... 575.3 1,851.4 5.3 166.4 — 5,398.7 (650.6) 7,346.5
Equity........................................ 3,218.4 1,314.3 1,953.5 4,433.6 5,306.3 2,248.4 (15,256.1) 3,218.4
Total liabilities and equity ... £ 3,793.7 £ 3,165.7 £ 1,958.8 £ 4,600.0 £ 5,306.3 £ 7,647.1 £ (15,906.7) £ 10,564.9
_________________
(a) As retrospectively revised - see note 2.