Virgin Media 2013 Annual Report Download - page 47
Download and view the complete annual report
Please find page 47 of the 2013 Virgin Media annual report below. You can navigate through the pages in the report by either clicking on the pages listed below, or by using the keyword search tool below to find specific information within the annual report.-
 1
1 -
2
-
3
-
4
-
5
-
6
-
7
-
8
-
9
-
10
-
11
-
12
-
13
-
14
-
15
-
16
-
17
-
18
-
19
-
20
-
21
-
22
-
23
-
24
-
25
-
26
-
27
-
28
-
29
-
30
-
31
-
32
-
33
-
34
-
35
-
36
-
 37
37 -
 38
38 -
 39
39 -
 40
40 -
 41
41 -
 42
42 -
 43
43 -
 44
44 -
 45
45 -
 46
46 -
 47
47 -
 48
48 -
 49
49 -
 50
50 -
 51
51 -
 52
52 -
 53
53 -
 54
54 -
 55
55 -
 56
56 -
 57
57 -
58
-
59
-
60
-
61
-
62
-
63
-
64
-
65
-
66
-
67
-
68
-
69
-
70
-
71
-
72
-
73
-
74
-
75
-
76
-
77
-
78
-
79
-
80
-
81
-
82
-
83
-
84
-
85
-
86
-
87
-
88
-
89
-
90
-
91
-
92
-
93
-
94
-
95
-
96
-
97
-
98
-
99
-
100
-
101
-
102
-
103
-
104
-
105
-
106
-
107
-
108
-
109
-
110
-
111
-
112
-
113
-
114
-
115
-
116
-
117
-
118
-
119
-
120
-
121
-
122
-
123
-
124
-
125
-
126
-
127
-
128
-
129
-
130
-
131
-
132
-
133
-
134
-
135
-
136
-
137
-
138
-
139
 |
 |

VIRGIN MEDIA INC.
(See note 1)
Notes to Consolidated Financial Statements — (Continued)
December 31, 2013, 2012 and 2011
II - 22
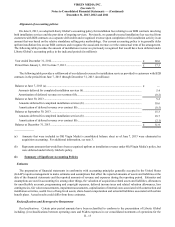
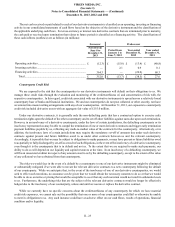
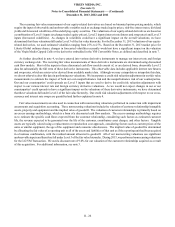
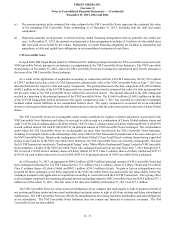
aggregating £3.1 million and £4.8 million, respectively, and (ii) the fair values of our cross-currency and interest rate
derivative contracts that represented liabilities have been reduced by credit risk valuation adjustments aggregating £32.8
million and £11.5 million, respectively. The adjustments to our derivative assets relate to the credit risk associated with
counterparty nonperformance and the adjustments to our derivative liabilities relate to credit risk associated with our own
nonperformance. In all cases, the adjustments take into account offsetting liability or asset positions within a given contract.
Our determination of credit risk valuation adjustments generally is based on our and our counterparties’ credit risks, as
observed in the credit default swap market and market quotations for certain of our debt instruments, as applicable. The
changes in the credit risk valuation adjustments associated with our cross-currency and interest rate derivative contracts
resulted in net gains (losses) of £29.7 million and (£6.8 million) during the Successor period from June 8 to December 31,
2013 and the Predecessor period from January 1 to June 7, 2013, respectively, and net gains (losses) of £24.8 million and
(£4.2 million) during the years ended December 31, 2012 and 2011, respectively. The amounts included in realized and
unrealized gains (losses) on derivative instruments, net, in our consolidated statements of operations were £29.7 million,
£0.7 million, £6.3 million and (£8.6 million) for the Successor period from June 8 to December 31, 2013, the Predecessor
period from January 1 to June 7, 2013, and the years ended December 31, 2012 and 2011, respectively. The amounts
included in net unrealized gains (losses) on derivative instruments, in our consolidated statements of comprehensive earnings
(loss) were nil, (£7.5 million), £18.5 million and £4.4 million for the Successor period from June 8 to December 31, 2013,
the Predecessor period from January 1 to June 7, 2013, and the years ended December 31, 2012 and 2011, respectively. For
further information concerning our fair value measurements, see note 5.
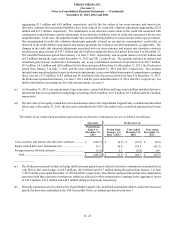
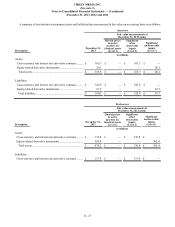
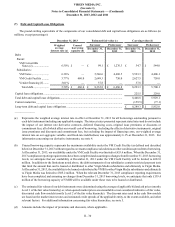
(c) At December 31, 2012, our current assets, long-term assets, current liabilities and long-term liabilities included derivative
instruments that were accounted for using hedge accounting of £25.6 million, £127.6 million, £9.3 million and £54.5 million,
respectively.
(d) The fair value of our equity-related derivative instruments relate to the Virgin Media Capped Calls, as defined and described
below, and, at December 31, 2013, the derivative embedded in the VM Convertible Notes, as defined and described in note
7.
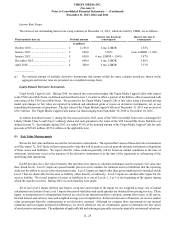
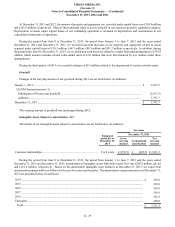
The details of our realized and unrealized gains (losses) on derivative instruments, net, are as follows (in millions):
Successor Predecessor (a)
Period from
June 8 to
December 31,
2013
Period from
January 1 to
June 7, 2013
Year ended
December 31,
2012
Year ended
December 31,
2011
Cross-currency and interest rate derivative contracts............ £(230.7) £ (0.3) £ (25.2) £ (8.3)
Equity-related derivative instruments (b) .............................. 31.1 50.0 174.1 (43.3)
Foreign currency forward contracts....................................... (3.8) 2.1 (0.8) 0.9
Total................................................................................... £(203.4) £ 51.8 £ 148.1 £ (50.7)
______________
(a) The Predecessor periods include net hedge ineffectiveness gains (losses) related to derivative instruments accounted for as
cash flow or fair value hedges of (£8.5 million), (£4.2 million) and £3.7 million during the period from January 1 to June
7, 2013 and the years ended December 31, 2012 and 2011, respectively. The effective portion of the net fair value adjustments
associated with these derivative instruments, which are reflected in other comprehensive earnings (loss), aggregated losses
of £10.8 million, £47.6 million and £46.5 million during such periods, respectively.
(b) Primarily represents activity related to the Virgin Media Capped Calls, as defined and described below, and in the Successor
period, the derivative embedded in the VM Convertible Notes, as defined and described in note 7.