Virgin Media 2013 Annual Report Download - page 126
Download and view the complete annual report
Please find page 126 of the 2013 Virgin Media annual report below. You can navigate through the pages in the report by either clicking on the pages listed below, or by using the keyword search tool below to find specific information within the annual report.-
 1
1 -
2
-
3
-
4
-
5
-
6
-
7
-
8
-
9
-
10
-
11
-
12
-
13
-
14
-
15
-
16
-
17
-
18
-
19
-
20
-
21
-
22
-
23
-
24
-
25
-
26
-
27
-
28
-
29
-
30
-
31
-
32
-
33
-
34
-
35
-
36
-
37
-
38
-
39
-
40
-
41
-
42
-
43
-
44
-
45
-
46
-
47
-
48
-
49
-
50
-
51
-
52
-
53
-
54
-
55
-
56
-
57
-
58
-
59
-
60
-
61
-
62
-
63
-
64
-
65
-
66
-
67
-
68
-
69
-
70
-
71
-
72
-
73
-
74
-
75
-
76
-
77
-
78
-
79
-
80
-
81
-
82
-
83
-
84
-
85
-
86
-
87
-
88
-
89
-
90
-
91
-
92
-
93
-
94
-
95
-
96
-
97
-
98
-
99
-
100
-
101
-
102
-
103
-
104
-
105
-
106
-
107
-
108
-
109
-
110
-
111
-
112
-
113
-
114
-
115
-
 116
116 -
 117
117 -
 118
118 -
 119
119 -
 120
120 -
 121
121 -
 122
122 -
 123
123 -
 124
124 -
 125
125 -
 126
126 -
 127
127 -
 128
128 -
 129
129 -
 130
130 -
 131
131 -
 132
132 -
 133
133 -
 134
134 -
 135
135 -
 136
136 -
137
-
138
-
139
 |
 |
III - 16
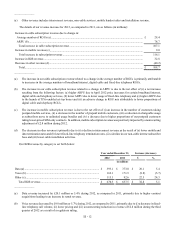
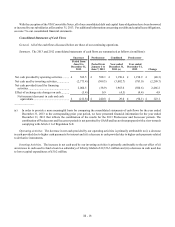
Income tax benefit (expense)
We recognized income tax benefit of £2,652.0 million and income tax expense of £16.0 million during 2012 and 2011,
respectively.
The income tax benefit during 2012 differs from the expected income tax expense of £91.5 million (based on the U.S. federal
income tax rate of 35%) due primarily to the positive impacts of (i) a net decrease in valuation allowances of £2,675.7 million
primarily related to the reversal of valuation allowances on certain of our U.K. deferred tax assets as these tax assets were deemed
realizable in the period and (ii) certain permanent differences between the financial and tax accounting treatment of interest and
other items. The reversal of the valuation allowance is attributable to the accumulation of positive evidence on the realizability
of these deferred tax assets, including (i) pre-tax income generated for the each of the two years ended December 31, 2012, (ii)
capital allowances and net operating losses that do not expire, (iii) improved financial performance and (iv) our then forecasted
projections of future taxable income, which, as of the fourth quarter of 2012, outweighed the negative evidence, which was primarily
a history of taxable losses in periods prior to 2011.
The income tax expense during 2011 differs from the expected income tax expense of £32.6 million (based on the U.S. federal
income tax rate of 35%) due primarily to the positive impact of a net decrease in valuation allowances. The positive impact of
this item was partially offset by the negative impacts of (i) certain permanent differences between the financial and tax accounting
treatment of interest and other items and (ii) certain permanent differences between the financial and tax accounting treatment of
items associated with investments in subsidiaries.
For additional information concerning our income taxes, see note 8 to our consolidated financial statements.
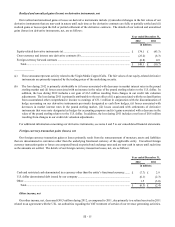
Earnings (loss) from continuing operations
During 2012 and 2011, we reported earnings from continuing operations of £2,913.4 million and £77.1 million, respectively,
including (i) operating income of £698.8 million and £536.7 million, respectively, (ii) non-operating expense of £437.4 million
and £443.6 million, respectively, and (iii) income tax benefit (expense) of £2,652.0 million and (£16.0 million), respectively.
Liquidity and Capital Resources
Sources and Uses of Cash
Cash and cash equivalents
Although our consolidated subsidiaries have generated cash from operating activities, the terms of the instruments governing
the indebtedness of certain of these subsidiaries may restrict our ability to access the assets of these subsidiaries. At December 31,
2013, we had cash and cash equivalents of £343.0 million, of which £29.7 million was held by our subsidiaries. In addition, our
ability to access the liquidity of our subsidiaries may be limited by tax and legal considerations and other factors.
Liquidity of Virgin Media
Our sources of liquidity at the parent level include (i) our cash and cash equivalents, (ii) funding from Lynx Europe 2, our
immediate parent, (and ultimately from Liberty Global or other Liberty Global subsidiaries) in the form of loans or contributions,
as applicable, and (iii) subject to the restrictions noted above, proceeds in the form of distributions or loans from our operating
subsidiaries. For information regarding limitations imposed by our subsidiaries’ debt instruments, see note 7 to our consolidated
financial statements.
The ongoing cash needs of Virgin Media include corporate general and administrative expenses and interest expense on the
VM Convertible Notes. From time to time, Virgin Media may also require cash in connection with (a) the repayment of outstanding
debt and related-party obligations, (b) the satisfaction of contingent liabilities or (c) acquisitions and other investment opportunities.
No assurance can be given that funding from Lynx Europe 2 (and ultimately from Liberty Global or other Liberty Global
subsidiaries), our subsidiaries or external sources would be available on favorable terms, or at all.
Liquidity of our Operating Subsidiaries
In addition to cash and cash equivalents, the primary sources of liquidity of our operating subsidiaries are cash provided by
operations and, in the case of VMIH, any borrowing availability under the VM Revolving Facility. For details of the borrowing
availability of the VM Revolving Facility, see note 7 to our consolidated financial statements.