Virgin Media 2013 Annual Report Download - page 55
Download and view the complete annual report
Please find page 55 of the 2013 Virgin Media annual report below. You can navigate through the pages in the report by either clicking on the pages listed below, or by using the keyword search tool below to find specific information within the annual report.-
 1
1 -
2
-
3
-
4
-
5
-
6
-
7
-
8
-
9
-
10
-
11
-
12
-
13
-
14
-
15
-
16
-
17
-
18
-
19
-
20
-
21
-
22
-
23
-
24
-
25
-
26
-
27
-
28
-
29
-
30
-
31
-
32
-
33
-
34
-
35
-
36
-
37
-
38
-
39
-
40
-
41
-
42
-
43
-
44
-
 45
45 -
 46
46 -
 47
47 -
 48
48 -
 49
49 -
 50
50 -
 51
51 -
 52
52 -
 53
53 -
 54
54 -
 55
55 -
 56
56 -
 57
57 -
 58
58 -
 59
59 -
 60
60 -
 61
61 -
 62
62 -
 63
63 -
 64
64 -
 65
65 -
66
-
67
-
68
-
69
-
70
-
71
-
72
-
73
-
74
-
75
-
76
-
77
-
78
-
79
-
80
-
81
-
82
-
83
-
84
-
85
-
86
-
87
-
88
-
89
-
90
-
91
-
92
-
93
-
94
-
95
-
96
-
97
-
98
-
99
-
100
-
101
-
102
-
103
-
104
-
105
-
106
-
107
-
108
-
109
-
110
-
111
-
112
-
113
-
114
-
115
-
116
-
117
-
118
-
119
-
120
-
121
-
122
-
123
-
124
-
125
-
126
-
127
-
128
-
129
-
130
-
131
-
132
-
133
-
134
-
135
-
136
-
137
-
138
-
139
 |
 |

VIRGIN MEDIA INC.
(See note 1)
Notes to Consolidated Financial Statements — (Continued)
December 31, 2013, 2012 and 2011
II - 30
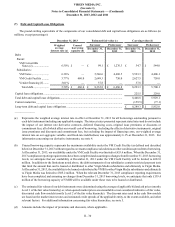
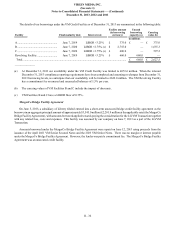
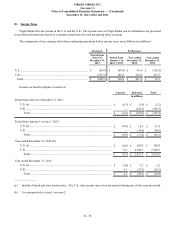
(7) Debt and Capital Lease Obligations
The pound sterling equivalents of the components of our consolidated debt and capital lease obligations are as follows (in
millions, except percentages):
December 31, 2013 Estimated fair value (c) Carrying value (d)
Weighted
average
interest rate (a)
Unused
borrowing
capacity (b)
Successor Predecessor Successor Predecessor
December 31,
2013 December 31,
2012 December 31,
2013 December 31,
2012
Debt:
Parent:
VM Convertible
Notes (e)....................... 6.50% £ — £ 99.1 £ 1,276.3 £ 34.7 £ 544.0
Subsidiaries:
VM Notes ........................ 6.36% — 5,546.6 4,660.5 5,523.3 4,406.1
VM Credit Facility .......... 3.77% 660.0 2,649.3 750.0 2,627.5 750.0
Vendor financing (f)........ 3.01% — 37.8 — 37.8 —
Total debt...................... 5.50% £ 660.0 £ 8,332.8 £ 6,686.8 8,223.3 5,700.1
Capital lease obligations .............................................................................................................. 225.5 229.0
Total debt and capital lease obligations....................................................................................... 8,448.8 5,929.1
Current maturities ........................................................................................................................ (159.5)(77.1)
Long-term debt and capital lease obligations .............................................................................. £ 8,289.3 £ 5,852.0
______________
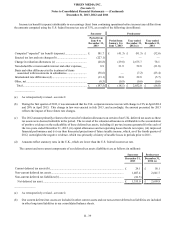
(a) Represents the weighted average interest rate in effect at December 31, 2013 for all borrowings outstanding pursuant to
each debt instrument including any applicable margin. The interest rates presented represent stated rates and do not include
the impact of our interest rate derivative contracts, deferred financing costs, original issue premiums or discounts or
commitment fees, all of which affect our overall cost of borrowing. Including the effects of derivative instruments, original
issue premiums and discounts and commitment fees, but excluding the impact of financing costs, our weighted average
interest rate on our aggregate variable- and fixed-rate indebtedness was approximately 6.1% at December 31, 2013. For
information concerning our derivative instruments, see note 4.
(b) Unused borrowing capacity represents the maximum availability under the VM Credit Facility (as defined and described
below) at December 31, 2013 without regard to covenant compliance calculations or other conditions precedent to borrowing.
At December 31, 2013, our availability under the VM Credit Facility was limited to £653.6 million. When the December 31,
2013 compliance reporting requirements have been completed and assuming no changes from December 31, 2013 borrowing
levels, we anticipate that our availability at December 31, 2013 under the VM Credit Facility will be limited to £622.0
million. In addition to the limitations noted above, the debt instruments of our subsidiaries contain restricted payment tests
that limit the amount that can be loaned or distributed to other Virgin Media subsidiaries and ultimately to Virgin Media.
At December 31, 2013, the availability to be loaned or distributed by VMIH to other Virgin Media subsidiaries and ultimately
to Virgin Media was limited to £305.2 million. When the relevant December 31, 2013 compliance reporting requirements
have been completed and assuming no changes from December 31, 2013 borrowing levels, we anticipate that only £139.4
million of the borrowing capacity of VMIH will be available under these tests to be loaned or distributed.
(c) The estimated fair values of our debt instruments were determined using the average of applicable bid and ask prices (mostly
Level 1 of the fair value hierarchy) or, when quoted market prices are unavailable or not considered indicative of fair value,
discounted cash flow models (mostly Level 2 of the fair value hierarchy). The discount rates used in the cash flow models
are based on the market interest rates and estimated credit spreads of the applicable entity, to the extent available, and other
relevant factors. For additional information concerning fair value hierarchies, see note 5.
(d) Amounts include the impact of premiums and discounts, where applicable.