Virgin Media 2013 Annual Report Download - page 30
Download and view the complete annual report
Please find page 30 of the 2013 Virgin Media annual report below. You can navigate through the pages in the report by either clicking on the pages listed below, or by using the keyword search tool below to find specific information within the annual report.-
 1
1 -
2
-
3
-
4
-
5
-
6
-
7
-
8
-
9
-
10
-
11
-
12
-
13
-
14
-
15
-
16
-
17
-
18
-
19
-
 20
20 -
 21
21 -
 22
22 -
 23
23 -
 24
24 -
 25
25 -
 26
26 -
 27
27 -
 28
28 -
 29
29 -
 30
30 -
 31
31 -
 32
32 -
 33
33 -
 34
34 -
 35
35 -
 36
36 -
 37
37 -
 38
38 -
 39
39 -
 40
40 -
41
-
42
-
43
-
44
-
45
-
46
-
47
-
48
-
49
-
50
-
51
-
52
-
53
-
54
-
55
-
56
-
57
-
58
-
59
-
60
-
61
-
62
-
63
-
64
-
65
-
66
-
67
-
68
-
69
-
70
-
71
-
72
-
73
-
74
-
75
-
76
-
77
-
78
-
79
-
80
-
81
-
82
-
83
-
84
-
85
-
86
-
87
-
88
-
89
-
90
-
91
-
92
-
93
-
94
-
95
-
96
-
97
-
98
-
99
-
100
-
101
-
102
-
103
-
104
-
105
-
106
-
107
-
108
-
109
-
110
-
111
-
112
-
113
-
114
-
115
-
116
-
117
-
118
-
119
-
120
-
121
-
122
-
123
-
124
-
125
-
126
-
127
-
128
-
129
-
130
-
131
-
132
-
133
-
134
-
135
-
136
-
137
-
138
-
139
 |
 |

II - 5
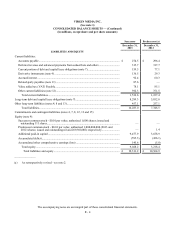
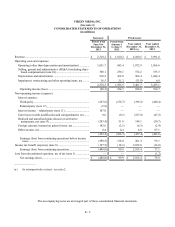
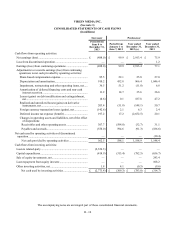
VIRGIN MEDIA INC.
(See note 1)
CONSOLIDATED STATEMENTS OF OPERATIONS
(in millions)
Successor Predecessor
Period from
June 8 to
December 31,
2013
Period from
January 1
to June 7,
2013
Year ended
December 31,
2012 (a)
Year ended
December 31,
2011
Revenue.......................................................................................... £ 2,310.2 £ 1,810.2 £ 4,100.5 £ 3,991.8
Operating costs and expenses:
Operating (other than depreciation and amortization) .............. 1,051.7 845.4 1,872.9 1,866.6
Selling, general and administrative (SG&A) (including share-
based compensation) (note 10).............................................. 380.1 256.1 574.2 535.3
Depreciation and amortization.................................................. 910.2 432.8 966.4 1,046.4
Impairment, restructuring and other operating items, net......... 36.5 51.2 (11.8) 6.8
2,378.5 1,585.5 3,401.7 3,455.1
Operating income (loss).......................................................... (68.3) 224.7 698.8 536.7
Non-operating income (expense):
Interest expense:
Third-party.............................................................................. (263.6)(156.7)(398.2)(440.4)
Related-party (note 11)........................................................... (5.8) — — —
Interest income – related-party (note 11).................................. 107.0 — — —
Gain (loss) on debt modification and extinguishment, net ....... 0.6 (0.1)(187.8)(47.2)
Realized and unrealized gains (losses) on derivative
instruments, net (note 4)........................................................ (203.4) 51.8 148.1 (50.7)
Foreign currency transaction gains (losses), net ....................... 142.6 (2.1)(6.3)(2.4)
Other income, net...................................................................... 0.4 0.4 6.8 97.1
(222.2)(106.7)(437.4)(443.6)
Earnings (loss) from continuing operations before income
taxes .................................................................................... (290.5) 118.0 261.4 93.1
Income tax benefit (expense) (note 8) ........................................... (197.5)(18.1) 2,652.0 (16.0)
Earnings (loss) from continuing operations............................ (488.0) 99.9 2,913.4 77.1
Loss from discontinued operation, net of tax (note 1)................... — — — (1.2)
Net earnings (loss).................................................................. £(488.0) £ 99.9 £ 2,913.4 £ 75.9
_______________
(a) As retrospectively revised - see note 2.
The accompanying notes are an integral part of these consolidated financial statements.