Virgin Media 2013 Annual Report Download - page 123
Download and view the complete annual report
Please find page 123 of the 2013 Virgin Media annual report below. You can navigate through the pages in the report by either clicking on the pages listed below, or by using the keyword search tool below to find specific information within the annual report.-
 1
1 -
2
-
3
-
4
-
5
-
6
-
7
-
8
-
9
-
10
-
11
-
12
-
13
-
14
-
15
-
16
-
17
-
18
-
19
-
20
-
21
-
22
-
23
-
24
-
25
-
26
-
27
-
28
-
29
-
30
-
31
-
32
-
33
-
34
-
35
-
36
-
37
-
38
-
39
-
40
-
41
-
42
-
43
-
44
-
45
-
46
-
47
-
48
-
49
-
50
-
51
-
52
-
53
-
54
-
55
-
56
-
57
-
58
-
59
-
60
-
61
-
62
-
63
-
64
-
65
-
66
-
67
-
68
-
69
-
70
-
71
-
72
-
73
-
74
-
75
-
76
-
77
-
78
-
79
-
80
-
81
-
82
-
83
-
84
-
85
-
86
-
87
-
88
-
89
-
90
-
91
-
92
-
93
-
94
-
95
-
96
-
97
-
98
-
99
-
100
-
101
-
102
-
103
-
104
-
105
-
106
-
107
-
108
-
109
-
110
-
111
-
112
-
 113
113 -
 114
114 -
 115
115 -
 116
116 -
 117
117 -
 118
118 -
 119
119 -
 120
120 -
 121
121 -
 122
122 -
 123
123 -
 124
124 -
 125
125 -
 126
126 -
 127
127 -
 128
128 -
 129
129 -
 130
130 -
 131
131 -
 132
132 -
 133
133 -
134
-
135
-
136
-
137
-
138
-
139
 |
 |
III - 13
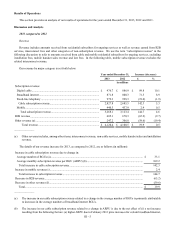
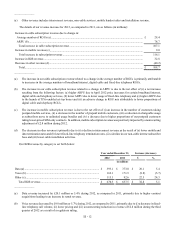
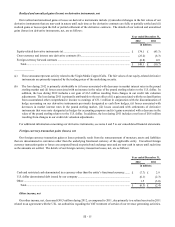
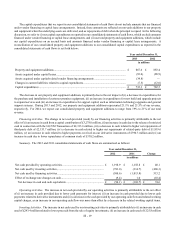
(c) Other revenue increased by £22.5 million or 24.3% during 2012, as compared to 2011, primarily due to the net effect of (i)
an increase in installation fees, (ii) an increase due to nonrecurring contract termination and modification fees and other
non-recurring items aggregating £19.2 million that were recognized during 2012 and (iii) a decrease in low margin equipment
sales.
Operating expenses
Our total operating expenses increased £6.3 million or 0.3% during 2012, as compared to 2011. This increase includes the
following factors:
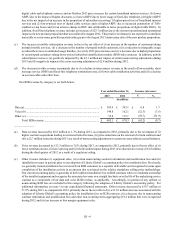
• A decrease in interconnect and access costs of £43.1 million or 10.3%, due primarily to the net effect of (i) lower mobile
and fixed-line telephony termination rates, (ii) a decline in B2B and residential telephony call volumes and (iii) a net
decrease due to the impact of (a) the release of accruals associated with the settlement and reassessment of operational
contingencies of £12.6 million during 2012 and (b) the release of an accrual associated with the reassessment of an
operational contingency of £6.1 million in 2011;
• An increase of £38.9 million in other direct costs primarily due to higher B2B circuit rental costs largely due to the
acquisition of a new customer;
• A decrease in outsourced labor and professional fees of £29.0 million or 28.9%, due primarily to decreased call center
costs mainly from the insourcing of certain customer care functions;
• An increase in programming and related costs of £24.6 million or 5.1%, due primarily to the impact of (i) growth in
digital videos services and (ii) an increase of £3.8 million due to the impact of an accrual release during 2011 in connection
with the settlement of an operational contingency;
• An increase in personnel costs of £12.1 million or 5.4%, due primarily to (i) an increase in staffing levels and (ii) a
decrease in capitalized costs due to the net effect of (a) a decrease in the level of capitalizable activities and (b) adjustments
made to our capitalization policy in the fourth quarter of 2012 to begin capitalizing certain upgrade activities that had
not previously been capitalized;
• An increase in network-related costs of £10.8 million or 6.5%, due largely to the net impact of (i) the negative impact of
a £6.5 million favorable settlement of an operational contingency during 2011, (ii) a £3.5 million decrease due to
adjustments made to our capitalization policy in the fourth quarter of 2012 to begin capitalizing certain upgrade activities
that had not previously been capitalized and (iii) higher maintenance costs;
• A decrease in bad debt and collection expenses of £6.5 million or 11.3% due to improved collection experience; and
• An increase in facilities costs of £1.3 million or 2.2%, primarily due to the net impact of (i) the negative impact of an
accrual release of £15.1 million during 2011 and (ii) property tax refunds of £9.6 million received during 2012.
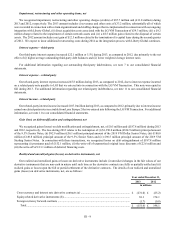
SG&A expenses
Our total SG&A expenses (exclusive of share-based compensation) increased £40.1 million or 7.9% during 2012, as compared
to 2011. This increase includes the following factors:
• An increase in marketing and advertising costs of £32.0 million or 18.2%, primarily due to higher advertising and
promotional activities;
• An increase in facilities related expense of £7.1 million, primarily due to the negative impact of an accrual release of
£6.5 million during 2011; and
• An increase in outsourced labor and professional fees of £6.5 million, primarily due to an increase in consulting costs.