Virgin Media 2013 Annual Report Download - page 129
Download and view the complete annual report
Please find page 129 of the 2013 Virgin Media annual report below. You can navigate through the pages in the report by either clicking on the pages listed below, or by using the keyword search tool below to find specific information within the annual report.-
 1
1 -
2
-
3
-
4
-
5
-
6
-
7
-
8
-
9
-
10
-
11
-
12
-
13
-
14
-
15
-
16
-
17
-
18
-
19
-
20
-
21
-
22
-
23
-
24
-
25
-
26
-
27
-
28
-
29
-
30
-
31
-
32
-
33
-
34
-
35
-
36
-
37
-
38
-
39
-
40
-
41
-
42
-
43
-
44
-
45
-
46
-
47
-
48
-
49
-
50
-
51
-
52
-
53
-
54
-
55
-
56
-
57
-
58
-
59
-
60
-
61
-
62
-
63
-
64
-
65
-
66
-
67
-
68
-
69
-
70
-
71
-
72
-
73
-
74
-
75
-
76
-
77
-
78
-
79
-
80
-
81
-
82
-
83
-
84
-
85
-
86
-
87
-
88
-
89
-
90
-
91
-
92
-
93
-
94
-
95
-
96
-
97
-
98
-
99
-
100
-
101
-
102
-
103
-
104
-
105
-
106
-
107
-
108
-
109
-
110
-
111
-
112
-
113
-
114
-
115
-
116
-
117
-
118
-
 119
119 -
 120
120 -
 121
121 -
 122
122 -
 123
123 -
 124
124 -
 125
125 -
 126
126 -
 127
127 -
 128
128 -
 129
129 -
 130
130 -
 131
131 -
 132
132 -
 133
133 -
 134
134 -
 135
135 -
 136
136 -
 137
137 -
 138
138 -
 139
139
 |
 |

III - 19
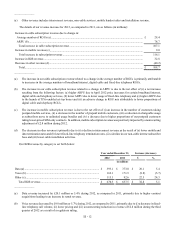
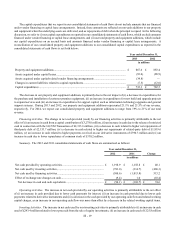
The capital expenditures that we report in our consolidated statements of cash flows do not include amounts that are financed
under vendor financing or capital lease arrangements. Instead, these amounts are reflected as non-cash additions to our property
and equipment when the underlying assets are delivered, and as repayments of debt when the principal is repaid. In the following
discussion, we refer to (i) our capital expenditures as reported in our consolidated statements of cash flows, which exclude amounts
financed under vendor financing or capital lease arrangements, and (ii) our total property and equipment additions, which include
our capital expenditures on an accrual basis and amounts financed under vendor financing or capital lease arrangements. A
reconciliation of our consolidated property and equipment additions to our consolidated capital expenditures as reported in the
consolidated statements of cash flows is set forth below:
Year ended December 31,
2013 2012
in millions
Property and equipment additions .................................................................................................... £ 867.6 £ 883.4
Assets acquired under capital leases................................................................................................. (93.0)(88.9)
Assets acquired under capital-related vendor financing arrangements ............................................ (34.8) —
Changes in current liabilities related to capital expenditures........................................................... (7.5)(12.0)
Capital expenditures ......................................................................................................................... £ 732.3 £ 782.5
The decrease in our property and equipment additions is primarily due to the net impact of (i) a decrease in expenditures for
the purchase and installation of customer premises equipment, (ii) an increase in expenditures for new build and upgrade projects
to expand services and (iii) an increase in expenditures for support capital, such as information technology upgrades and general
support systems. During 2013 and 2012, our property and equipment additions represented 21.1% and 21.5% of our revenue,
respectively. For 2014, we expect our consolidated property and equipment additions to range from 19% to 21% of our total
revenue.
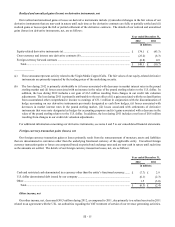
Financing Activities. The change in net cash provided (used) by our financing activities is primarily attributable to the net
effect of (i) an increase in cash from a capital contribution of £3,278.0 million, (ii) an increase in cash due to the release of restricted
cash in connection with the LG/VM Transaction of £2,313.6 million, (iii) a decrease in cash related to higher net repayments of
third-party debt of £2,153.7 million, (iv) a decrease in cash related to higher net repayments of related-party debt of £1,819.6
million, (v) an increase in cash related to higher payments received on our derivative instruments of £390.3 million and (vi) an
increase in cash due to lower repurchases of common stock of £330.2 million.
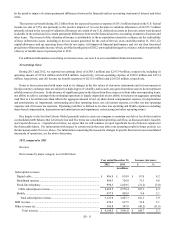
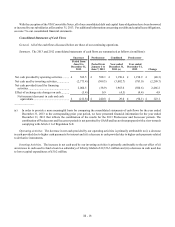
Summary. The 2012 and 2011 consolidated statements of cash flows are summarized as follows:
Year ended December 31,
2012 2011 Change
in millions
Net cash provided by operating activities ......................................................... £ 1,198.9 £ 1,158.8 £ 40.1
Net cash used by investing activities................................................................. (783.0)(314.7)(468.3)
Net cash used by financing activities ................................................................ (500.6)(1,013.8) 513.2
Effect of exchange rate changes on cash........................................................... (9.4) 1.0 (10.4)
Net decrease in cash and cash equivalents .................................................... £(94.1) £ (168.7) £ 74.6
Operating Activities. The increase in net cash provided by our operating activities is primarily attributable to the net effect
of (i) an increase in cash provided due to lower cash payments for interest, (ii) an increase in cash provided due to lower cash
payments related to derivative instruments and (iii) a decrease in the cash provided by our operating cash flow and related working
capital charges, as an increase in our operating cash flow was more than offset by a decrease in the related working capital items.
Investing Activities. The increase in net cash used by our investing activities is primarily attributable to (i) an increase in cash
used of £243.4 million related to lower proceeds from the sale of equity investments, (ii) an increase in cash used of £125.8 million