Virgin Media 2013 Annual Report Download - page 80
Download and view the complete annual report
Please find page 80 of the 2013 Virgin Media annual report below. You can navigate through the pages in the report by either clicking on the pages listed below, or by using the keyword search tool below to find specific information within the annual report.-
 1
1 -
2
-
3
-
4
-
5
-
6
-
7
-
8
-
9
-
10
-
11
-
12
-
13
-
14
-
15
-
16
-
17
-
18
-
19
-
20
-
21
-
22
-
23
-
24
-
25
-
26
-
27
-
28
-
29
-
30
-
31
-
32
-
33
-
34
-
35
-
36
-
37
-
38
-
39
-
40
-
41
-
42
-
43
-
44
-
45
-
46
-
47
-
48
-
49
-
50
-
51
-
52
-
53
-
54
-
55
-
56
-
57
-
58
-
59
-
60
-
61
-
62
-
63
-
64
-
65
-
66
-
67
-
68
-
69
-
 70
70 -
 71
71 -
 72
72 -
 73
73 -
 74
74 -
 75
75 -
 76
76 -
 77
77 -
 78
78 -
 79
79 -
 80
80 -
 81
81 -
 82
82 -
 83
83 -
 84
84 -
 85
85 -
 86
86 -
 87
87 -
 88
88 -
 89
89 -
 90
90 -
91
-
92
-
93
-
94
-
95
-
96
-
97
-
98
-
99
-
100
-
101
-
102
-
103
-
104
-
105
-
106
-
107
-
108
-
109
-
110
-
111
-
112
-
113
-
114
-
115
-
116
-
117
-
118
-
119
-
120
-
121
-
122
-
123
-
124
-
125
-
126
-
127
-
128
-
129
-
130
-
131
-
132
-
133
-
134
-
135
-
136
-
137
-
138
-
139
 |
 |

VIRGIN MEDIA INC.
(See note 1)
Notes to Consolidated Financial Statements — (Continued)
December 31, 2013, 2012 and 2011
II - 55
• Ensure that funds are available to pay benefits as they become due;
• Maximize the total returns on plan assets subject to prudent risk taking; and
• Preserve or improve the funded status of the trusts over time.
We review the asset allocation within their respective portfolios on a regular basis. Generally, the portfolios will be rebalanced
to a target allocation when an individual asset class approaches its minimum or maximum targeted level.
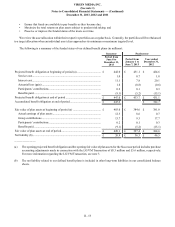
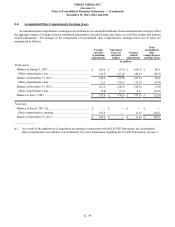
The following is a summary of the funded status of our defined benefit plans (in millions):
Successor Predecessor
Period from
June 8 to
December 31,
2013
Period from
January 1 to
June 7, 2013
Year ended
December 31,
2012
Projected benefit obligation at beginning of period (a).................................. £ 442.0 £ 431.1 £ 424.6
Service cost................................................................................................ 1.0 0.7 1.8
Interest cost................................................................................................ 11.1 7.8 20.1
Actuarial loss (gain) .................................................................................. 1.8 (0.8)(0.6)
Participants’ contributions......................................................................... 0.2 0.1 0.3
Benefits paid.............................................................................................. (9.1)(5.2)(15.1)
Projected benefit obligation at end of period ................................................. £ 447.0 £ 433.7 £ 431.1
Accumulated benefit obligation at end of period........................................... £ 443.6 £ 342.7
Fair value of plan assets at beginning of period (a) ....................................... £ 403.0 £ 384.6 £ 381.0
Actual earnings of plan assets ................................................................... 12.3 8.6 0.7
Group contributions................................................................................... 13.7 9.3 17.7
Participants’ contributions......................................................................... 0.2 0.1 0.3
Benefits paid.............................................................................................. (9.1)(5.2)(15.1)
Fair value of plan assets at end of period....................................................... £ 420.1 £ 397.4 £ 384.6
Net liability (b)............................................................................................... £ 26.9 £ 36.3 £ 46.5
_______________
(a) The opening projected benefit obligation and the opening fair value of plan assets for the Successor period includes purchase
accounting adjustments made in connection with the LG/VM Transaction of £8.3 million and £5.6 million, respectively.
For more information regarding the LG/VM Transaction, see note 3.
(b) The net liability related to our defined benefit plans is included in other long-term liabilities in our consolidated balance
sheets.