Virgin Media 2013 Annual Report Download - page 54
Download and view the complete annual report
Please find page 54 of the 2013 Virgin Media annual report below. You can navigate through the pages in the report by either clicking on the pages listed below, or by using the keyword search tool below to find specific information within the annual report.-
 1
1 -
2
-
3
-
4
-
5
-
6
-
7
-
8
-
9
-
10
-
11
-
12
-
13
-
14
-
15
-
16
-
17
-
18
-
19
-
20
-
21
-
22
-
23
-
24
-
25
-
26
-
27
-
28
-
29
-
30
-
31
-
32
-
33
-
34
-
35
-
36
-
37
-
38
-
39
-
40
-
41
-
42
-
43
-
 44
44 -
 45
45 -
 46
46 -
 47
47 -
 48
48 -
 49
49 -
 50
50 -
 51
51 -
 52
52 -
 53
53 -
 54
54 -
 55
55 -
 56
56 -
 57
57 -
 58
58 -
 59
59 -
 60
60 -
 61
61 -
 62
62 -
 63
63 -
 64
64 -
65
-
66
-
67
-
68
-
69
-
70
-
71
-
72
-
73
-
74
-
75
-
76
-
77
-
78
-
79
-
80
-
81
-
82
-
83
-
84
-
85
-
86
-
87
-
88
-
89
-
90
-
91
-
92
-
93
-
94
-
95
-
96
-
97
-
98
-
99
-
100
-
101
-
102
-
103
-
104
-
105
-
106
-
107
-
108
-
109
-
110
-
111
-
112
-
113
-
114
-
115
-
116
-
117
-
118
-
119
-
120
-
121
-
122
-
123
-
124
-
125
-
126
-
127
-
128
-
129
-
130
-
131
-
132
-
133
-
134
-
135
-
136
-
137
-
138
-
139
 |
 |

VIRGIN MEDIA INC.
(See note 1)
Notes to Consolidated Financial Statements — (Continued)
December 31, 2013, 2012 and 2011
II - 29
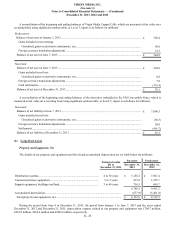
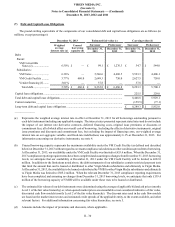
At December 31, 2013 and 2012, the amount of property and equipment, net, recorded under capital leases was £305.9 million
and £242.6 million, respectively. Most of these amounts relate to assets included in our customer premises equipment category.
Depreciation of assets under capital leases of our continuing operations is included in depreciation and amortization in our
consolidated statements of operations.
During the period from June 8 to December 31, 2013, the period from January 1 to June 7, 2013 and the years ended
December 31, 2012 and December 31, 2011, we recorded non-cash increases to our property and equipment related to assets
acquired under capital leases of £28.3 million, £64.7 million, £88.9 million and £91.2 million, respectively. In addition, during
the period from June 8 to December 31, 2013, we recorded non-cash increases related to vendor financing arrangements of £34.8
million, which amount excludes related value-added taxes of £3.0 million that were also financed by our vendors under these
arrangements.
During the third quarter of 2013, we recorded a charge of £9.2 million related to the impairment of certain network assets.
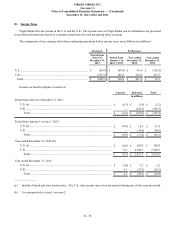
Goodwill
Changes in the carrying amount of our goodwill during 2013 are set forth below (in millions):
January 1, 2013....................................................................................................................................................... £ 2,017.5
LG/VM Transaction (note 3):
Elimination of Predecessor goodwill................................................................................................................. (2,017.5)
Addition ............................................................................................................................................................. 5,793.7
December 31, 2013................................................................................................................................................. £ 5,793.7
The carrying amount of goodwill was unchanged during 2012.
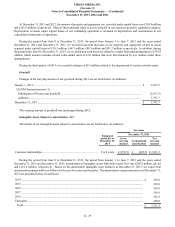
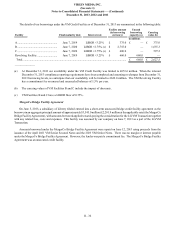
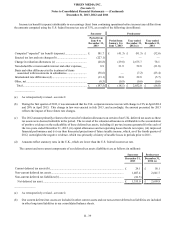
Intangible Assets Subject to Amortization, Net
The details of our intangible assets subject to amortization are set forth below (in millions):
Estimated
useful life at
December 31,
2013
Successor
December 31, 2013
Gross
carrying
amount Accumulated
amortization
Net
carrying
amount
Customer relationships............................................................................... 5 to 8 years £ 2,527.0 £ (205.5) £ 2,321.5
During the period from June 8 to December 31, 2013, the period from January 1 to June 7, 2013 and the years ended
December 31, 2012 and December 31, 2011, amortization of intangible assets with finite useful lives was £205.5 million, nil, nil
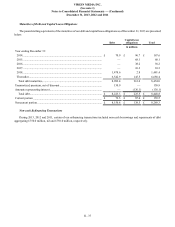
and £118.4 million, respectively. Based on the amortizable intangible asset balances at December 31, 2013, we expect that
amortization expense will be as follows for the next five years and thereafter. The amortization expense amounts as of December 31,
2013 are presented below (in millions):
2014 .......................................................................................................................................................................... £ 365.0
2015 .......................................................................................................................................................................... 365.0
2016 .......................................................................................................................................................................... 365.0
2017 .......................................................................................................................................................................... 365.0
2018 .......................................................................................................................................................................... 363.5
Thereafter.................................................................................................................................................................. 498.0
Total........................................................................................................................................................................ £ 2,321.5