Virgin Media 2013 Annual Report Download - page 82
Download and view the complete annual report
Please find page 82 of the 2013 Virgin Media annual report below. You can navigate through the pages in the report by either clicking on the pages listed below, or by using the keyword search tool below to find specific information within the annual report.-
 1
1 -
2
-
3
-
4
-
5
-
6
-
7
-
8
-
9
-
10
-
11
-
12
-
13
-
14
-
15
-
16
-
17
-
18
-
19
-
20
-
21
-
22
-
23
-
24
-
25
-
26
-
27
-
28
-
29
-
30
-
31
-
32
-
33
-
34
-
35
-
36
-
37
-
38
-
39
-
40
-
41
-
42
-
43
-
44
-
45
-
46
-
47
-
48
-
49
-
50
-
51
-
52
-
53
-
54
-
55
-
56
-
57
-
58
-
59
-
60
-
61
-
62
-
63
-
64
-
65
-
66
-
67
-
68
-
69
-
70
-
71
-
 72
72 -
 73
73 -
 74
74 -
 75
75 -
 76
76 -
 77
77 -
 78
78 -
 79
79 -
 80
80 -
 81
81 -
 82
82 -
 83
83 -
 84
84 -
 85
85 -
 86
86 -
 87
87 -
 88
88 -
 89
89 -
 90
90 -
 91
91 -
 92
92 -
93
-
94
-
95
-
96
-
97
-
98
-
99
-
100
-
101
-
102
-
103
-
104
-
105
-
106
-
107
-
108
-
109
-
110
-
111
-
112
-
113
-
114
-
115
-
116
-
117
-
118
-
119
-
120
-
121
-
122
-
123
-
124
-
125
-
126
-
127
-
128
-
129
-
130
-
131
-
132
-
133
-
134
-
135
-
136
-
137
-
138
-
139
 |
 |

VIRGIN MEDIA INC.
(See note 1)
Notes to Consolidated Financial Statements — (Continued)
December 31, 2013, 2012 and 2011
II - 57
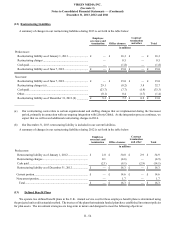
The components of net periodic pension cost recorded in our consolidated statements of operations are as follows (in millions):
Successor Predecessor
Period from
June 8 to
December 31,
2013
Period from
January 1 to
June 7, 2013
Year ended
December 31,
2012
Year ended
December 31,
2011
Service cost............................................................................... £ 1.0 £ 0.7 £ 1.8 £ 1.7
Interest cost............................................................................... 11.1 7.8 20.1 21.1
Expected return on plan assets.................................................. (12.5)(8.6)(18.3)(21.9)
Other ......................................................................................... — 0.8 2.6 0.6
Net periodic pension cost..................................................... £(0.4) £ 0.7 £ 6.2 £ 1.5
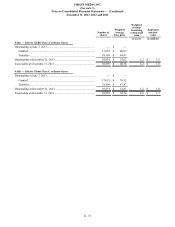
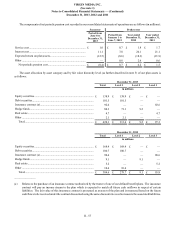
The asset allocation by asset category and by fair value hierarchy level (as further described in note 5) of our plan assets is
as follows:
December 31, 2013
Total Level 1 Level 2 Level 3
in millions
Equity securities................................................................................... £ 138.9 £ 138.9 £ — £ —
Debt securities...................................................................................... 101.5 101.5 — —
Insurance contract (a)........................................................................... 92.6 — — 92.6
Hedge funds ......................................................................................... 80.3 71.1 9.2 —
Real estate............................................................................................ 4.7 — — 4.7
Other .................................................................................................... 2.1 2.1 — —
Total................................................................................................. £ 420.1 £ 313.6 £ 9.2 £ 97.3
December 31, 2012
Total Level 1 Level 2 Level 3
in millions
Equity securities................................................................................... £ 168.4 £ 168.4 £ — £ —
Debt securities...................................................................................... 100.7 100.7 — —
Insurance contract (a)........................................................................... 90.6 — — 90.6
Hedge funds ......................................................................................... 9.1 — 9.1 —
Real estate............................................................................................ 5.2 — — 5.2
Other .................................................................................................... 10.6 10.6 — —
Total................................................................................................. £ 384.6 £ 279.7 £ 9.1 £ 95.8
_______________
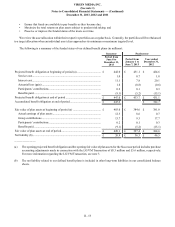
(a) Relates to the purchase of an insurance contract authorized by the trustee of one of our defined benefit plans. The insurance
contract will pay an income stream to the plan which is expected to match all future cash outflows in respect of certain
liabilities. The fair value of this insurance contract is presented as an asset of the plan and is measured based on the future
cash flows to be received under the contract discounted using the same discount rate used to measure the associated liabilities.