Virgin Media 2013 Annual Report Download - page 116
Download and view the complete annual report
Please find page 116 of the 2013 Virgin Media annual report below. You can navigate through the pages in the report by either clicking on the pages listed below, or by using the keyword search tool below to find specific information within the annual report.-
 1
1 -
2
-
3
-
4
-
5
-
6
-
7
-
8
-
9
-
10
-
11
-
12
-
13
-
14
-
15
-
16
-
17
-
18
-
19
-
20
-
21
-
22
-
23
-
24
-
25
-
26
-
27
-
28
-
29
-
30
-
31
-
32
-
33
-
34
-
35
-
36
-
37
-
38
-
39
-
40
-
41
-
42
-
43
-
44
-
45
-
46
-
47
-
48
-
49
-
50
-
51
-
52
-
53
-
54
-
55
-
56
-
57
-
58
-
59
-
60
-
61
-
62
-
63
-
64
-
65
-
66
-
67
-
68
-
69
-
70
-
71
-
72
-
73
-
74
-
75
-
76
-
77
-
78
-
79
-
80
-
81
-
82
-
83
-
84
-
85
-
86
-
87
-
88
-
89
-
90
-
91
-
92
-
93
-
94
-
95
-
96
-
97
-
98
-
99
-
100
-
101
-
102
-
103
-
104
-
105
-
 106
106 -
 107
107 -
 108
108 -
 109
109 -
 110
110 -
 111
111 -
 112
112 -
 113
113 -
 114
114 -
 115
115 -
 116
116 -
 117
117 -
 118
118 -
 119
119 -
 120
120 -
 121
121 -
 122
122 -
 123
123 -
 124
124 -
 125
125 -
 126
126 -
127
-
128
-
129
-
130
-
131
-
132
-
133
-
134
-
135
-
136
-
137
-
138
-
139
 |
 |

III - 6
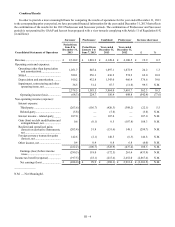
digital cable and telephony services and an October 2013 price increase for certain broadband internet services, (b) lower
ARPU due to the impact of higher discounts, (c) lower ARPU due to lower usage of fixed-line telephony, (d) higher ARPU
due to the net impact of an increase in the proportion of subscribers receiving (1) higher-priced tiers of broadband internet
services and (2) lower-priced tiers of digital cable services and (e) higher ARPU due to increased penetration of TiVo-
enabled set-top boxes and (ii) an adverse change in RGU mix attributable to lower proportions of digital cable RGUs. In
addition, fixed-line telephony revenue includes an increase of £23.7 million due to the net non-operational and operational
impacts of a new product proposition that was initiated in August 2012. This positive net impact is not expected to contribute
materially to our revenue growth in periods subsequent to the August 2013 anniversary date of the new product proposition.
(c) The increase in mobile subscription revenue is due to the net effect of (i) an increase in the number of customers taking
postpaid mobile services, (ii) a decrease in the number of prepaid mobile customers, (iii) a reduction in chargeable usage
as subscribers move to unlimited usage bundles, (iv) a July 2013 price increase and (v) a decrease due to higher proportions
of our postpaid customers taking lower-priced subscriber identification module (SIM)-only contracts. In addition, mobile
subscription revenue is (a) positively impacted by the £5.1 million net impact of certain nonrecurring adjustments during
2013 and (b) negatively impacted by a non-recurring adjustment of £2.8 million during 2012.
(d) The decrease in other revenue is primarily due to (i) a decline in interconnect revenue as the result of lower mobile, short
message service (SMS) and fixed-line telephony termination rates, (ii) lower cable installation activities and (iii) a decline
in our non-cable subscriber base.
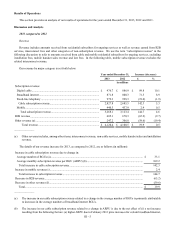
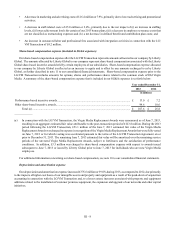
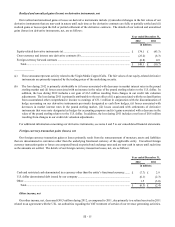
Our B2B revenue by category is set forth below:
Year ended December 31, Increase (decrease)
2013 2012 £%
in millions
Data (a)........................................................................................................ £ 399.9 £ 393.1 £ 6.8 1.7
Voice (b)...................................................................................................... 149.8 162.1 (12.3)(7.6)
Other (c)....................................................................................................... 55.4 115.1 (59.7)(51.9)
Total B2B revenue............................................................................. £ 605.1 £ 670.3 £ (65.2)(9.7)
______________
(a) Data revenue increased by £6.8 million or 1.7% during 2013, as compared to 2012, primarily due to the net impact of (i)
higher contract acquisitions leading to increased rental revenue, (ii) price reductions on the renewal of certain contracts and
(iii) a £2.7 million reduction during 2013 as a result of nonrecurring adjustments to certain revenue-related accrual balances.
(b) Voice revenue decreased by £12.3 million or 7.6% during 2013, as compared to 2012, primarily due to the net effect of (i)
lower termination rates, (ii) lower pricing and (iii) the favorable impact during 2013 of a reduction in revenue of £2.8 million
during the third quarter of 2012 as a result of a regulatory ruling.
(c) Other revenue includes (i) equipment sales, (ii) certain nonrecurring contract termination and modification fees and (iii)
installation revenue in periods prior to our adoption of Liberty Global’s accounting policy for installation fees. Previously,
we generally treated installation fees received from B2B customers as a separate deliverable and recognized revenue upon
completion of the installation activity in an amount that was based on the relative standalone selling price methodology.
Our current accounting policy is generally to defer upfront installation fees on B2B contracts where we maintain ownership
of the installed equipment and recognize the associated revenue on a straight line basis over the life of the underlying service
contract as a component of our data and voice B2B revenue, as applicable. Accordingly, no portion of any upfront or
nonrecurring B2B fees are included in this category following the adoption of Liberty Global’s accounting policy. For
additional information, see note 1 to our consolidated financial statements. Other revenue decreased by £59.7 million or
51.9% during 2013, as compared to 2012, primarily due to the net effect of (i) a £31.9 million decrease associated with the
adoption of Liberty Global’s accounting policy for installation fees on B2B contracts, (ii) a decrease due to nonrecurring
contract termination and modification fees and other non-recurring items aggregating £19.2 million that were recognized
during 2012 and (iii) an increase in low margin equipment sales.